Input Devices
measure something: add a sensor to a microcontroller board that you have designed and read it.
Used Hardware
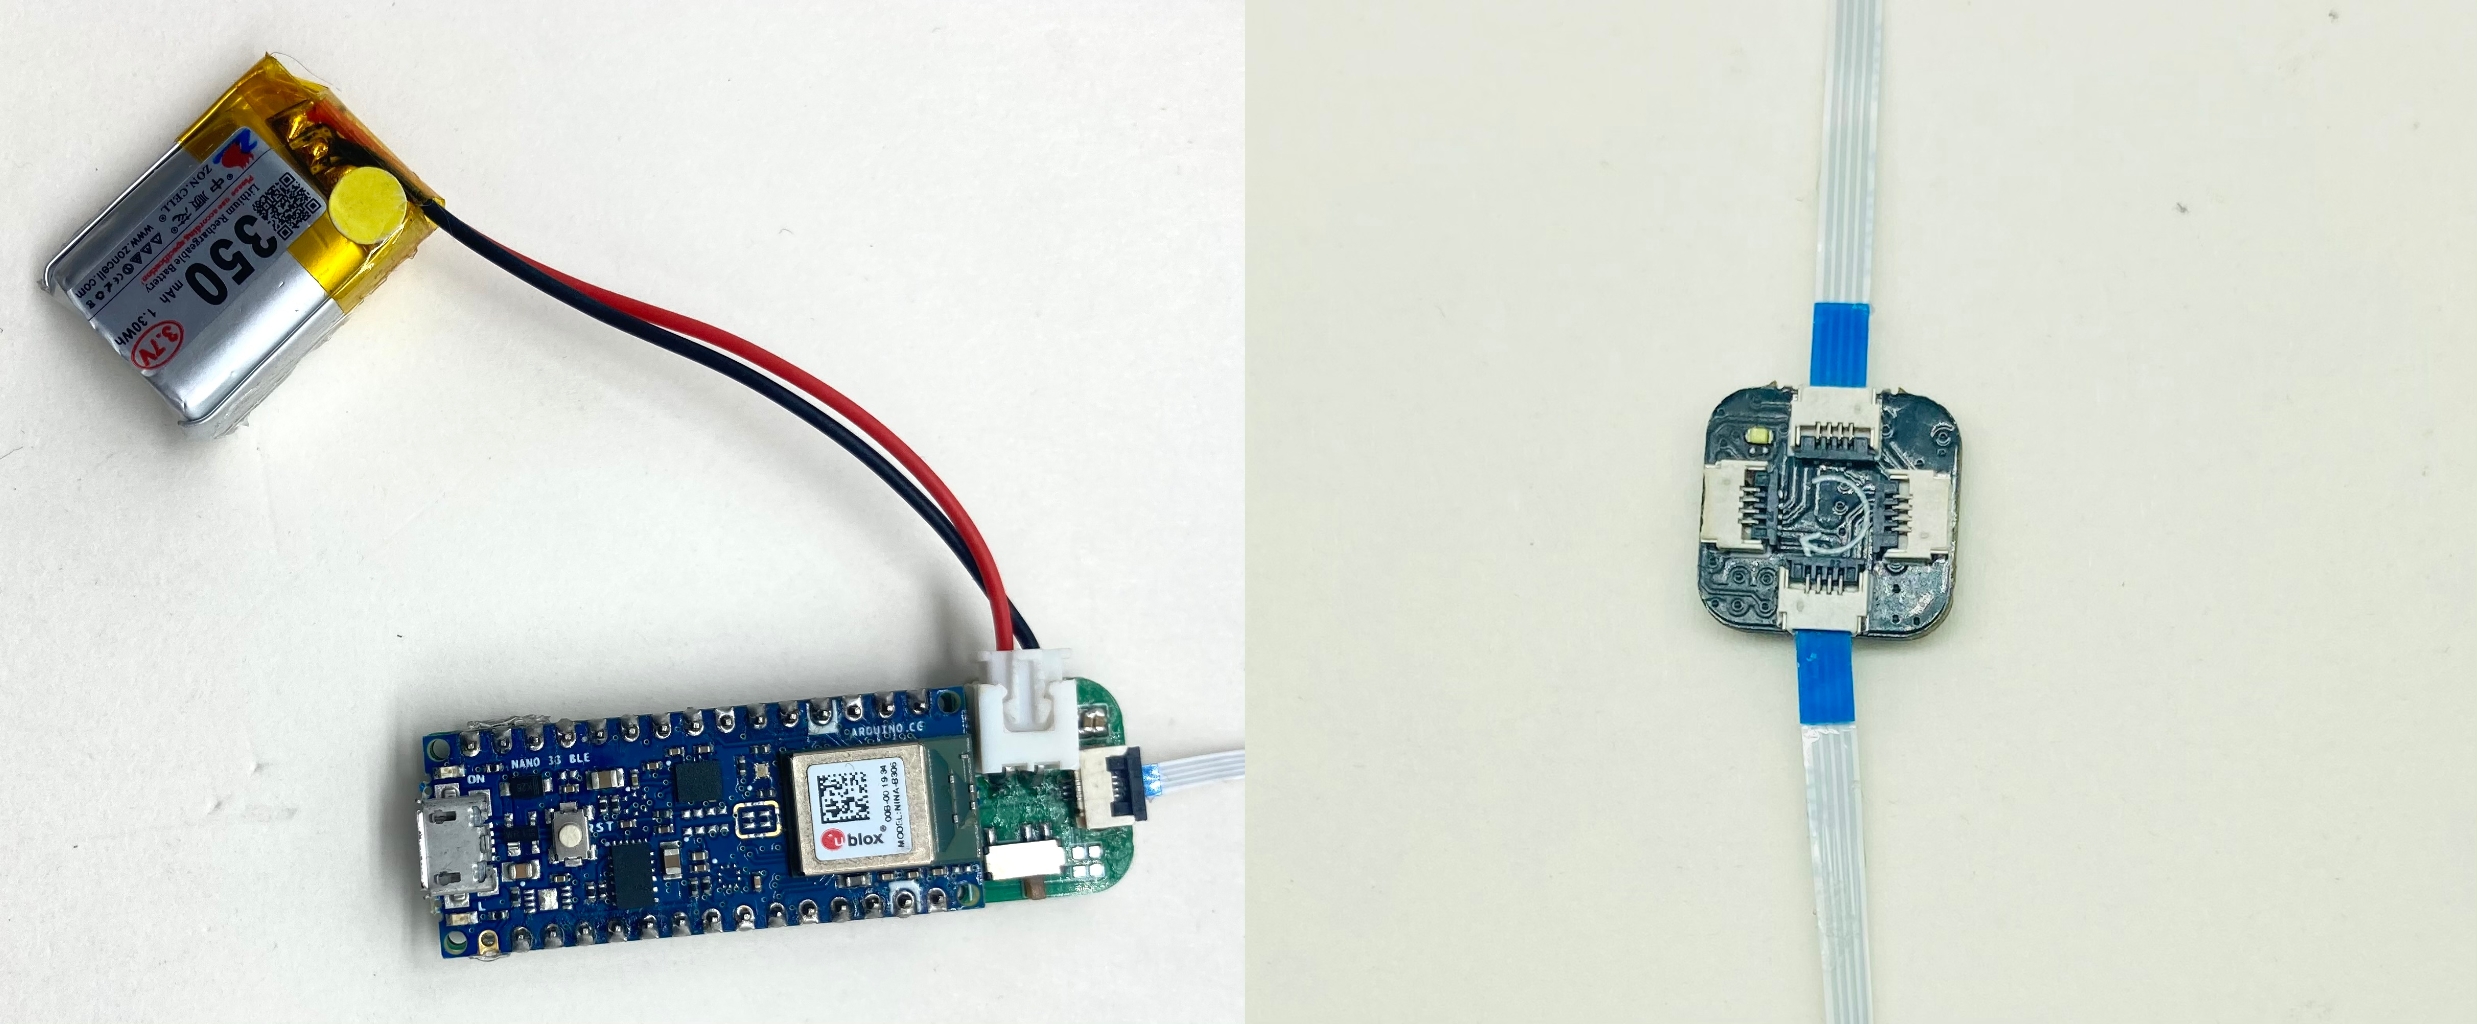
This week, I used the PCBs designed and fabricated in HW7 as the input device.
Amplification
These two pictures have larger components and can be seen more clearly.
Foot Motion Signals
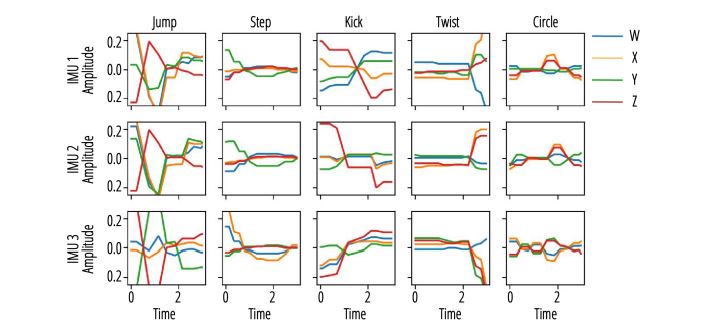
Then I put the device on the shoes and did some foot gestures. As shown in Figure, sample IMU signals are collected. The series in the graph illustrate the fluctuation of four value in the quaternions while performing five different type of foot gesture, collected from three IMUs on the right foot. Some intermediate data processing is described in detail below.
Raw Ouput
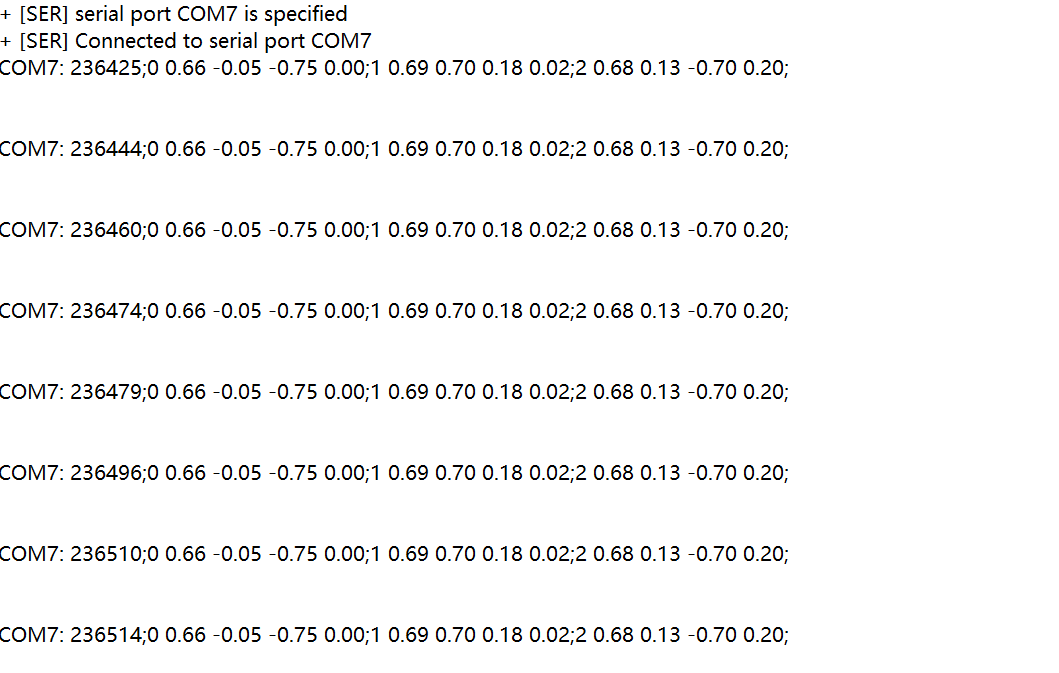
Here are some raw output.
Visualizing Each IMU Signal
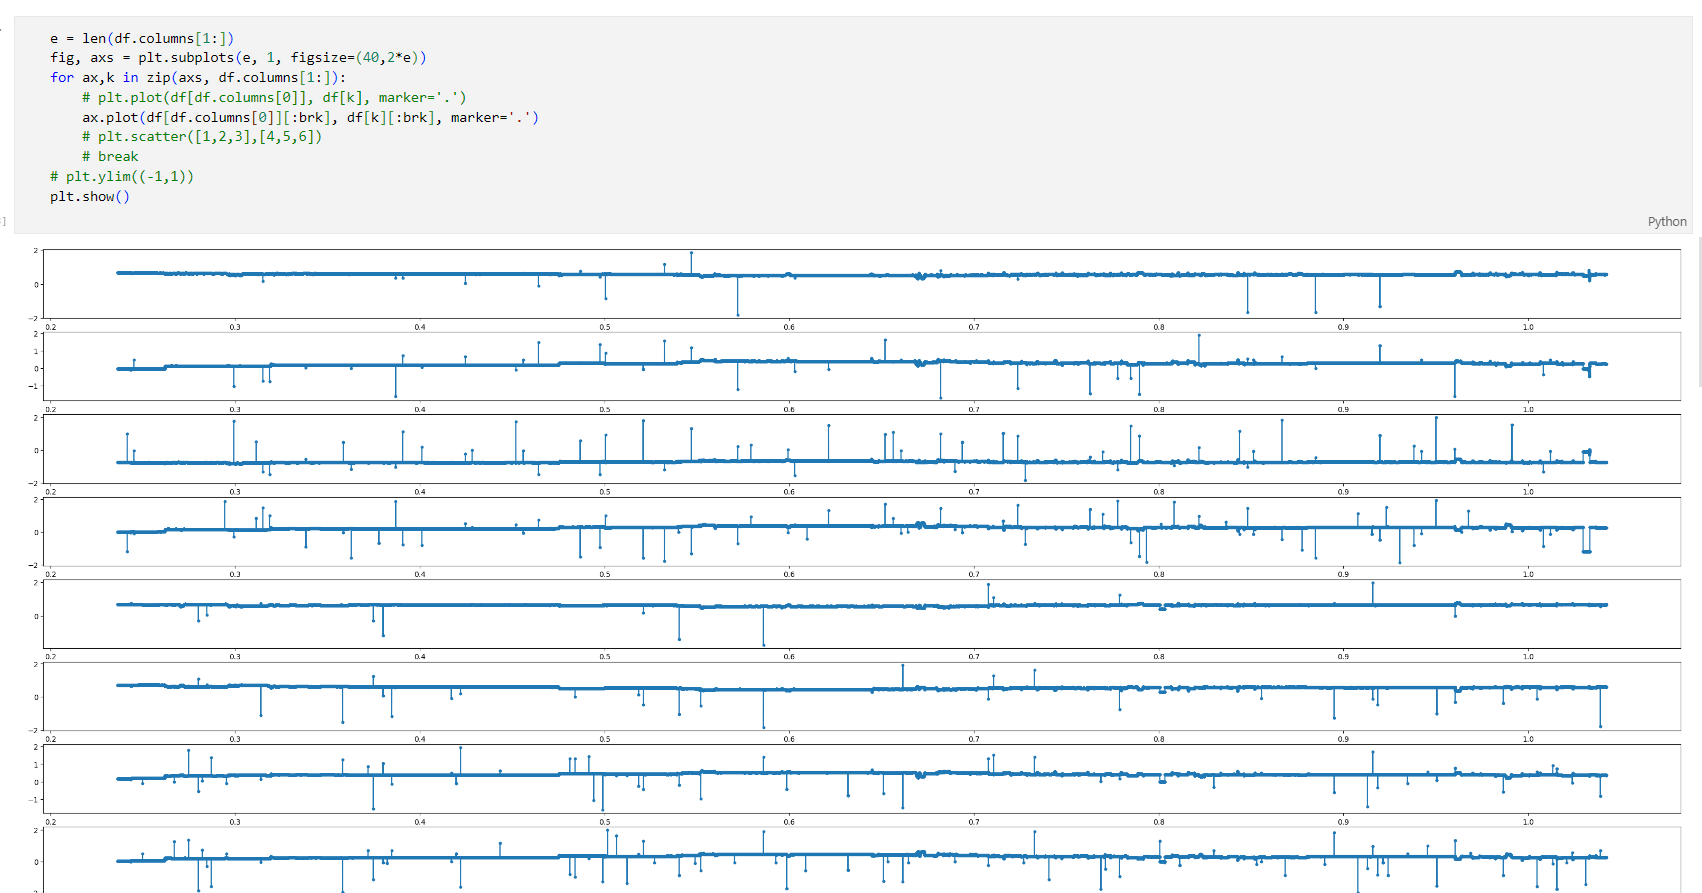
Then, I tried to visualize each IMU signal to check whether there is something wrong with each sensed IMU data.
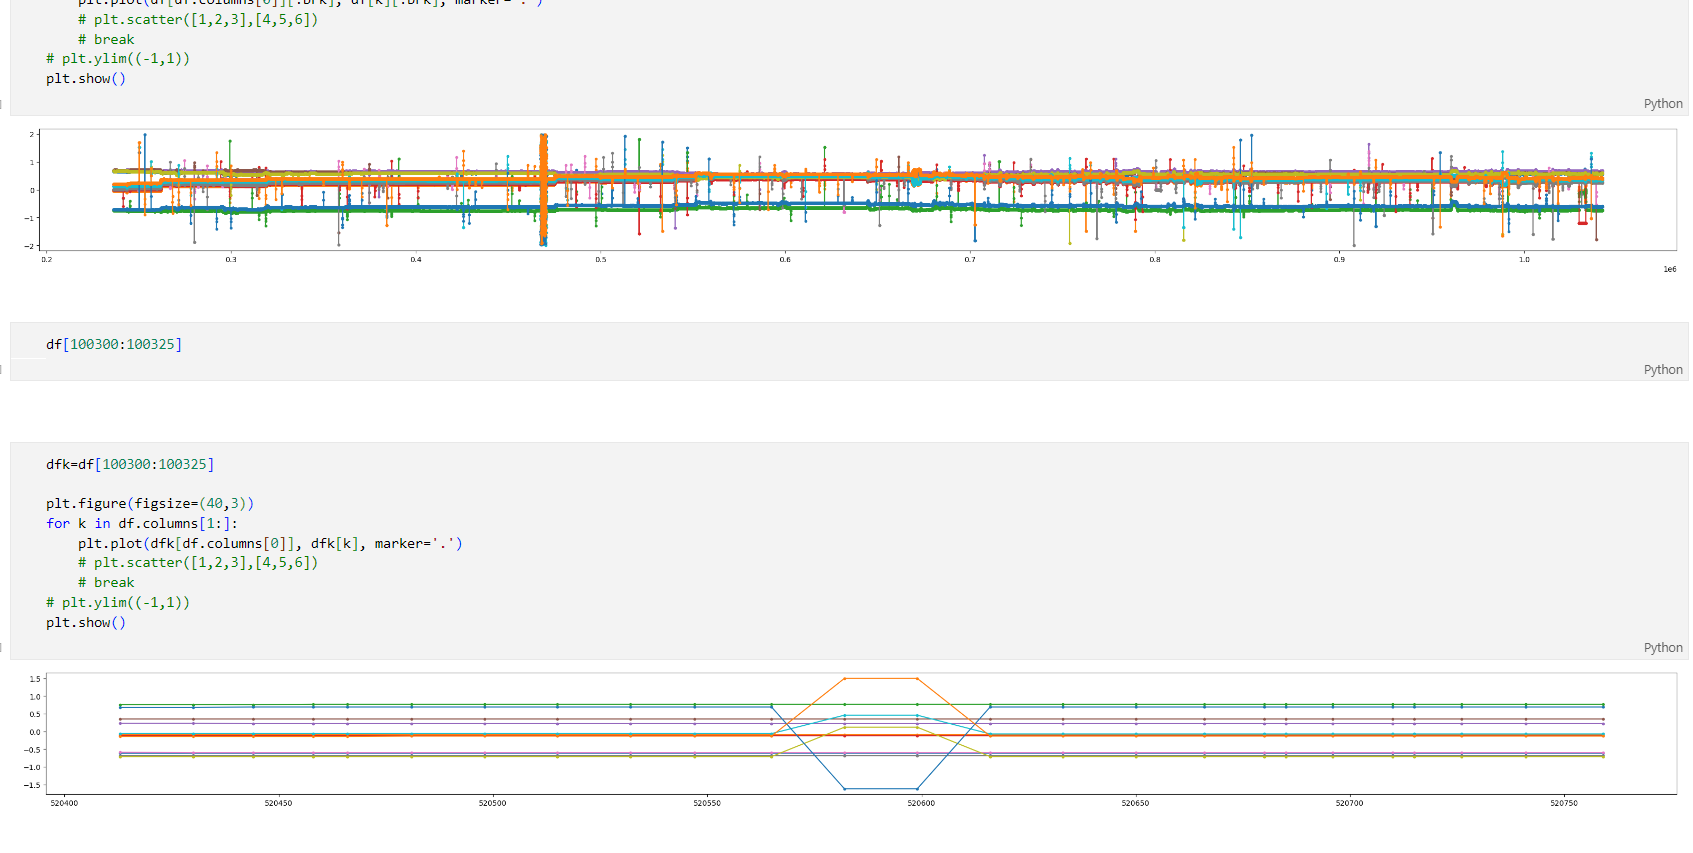
Visualizing IMU Signals Together
Then, I visualized all IMU data togerther to align the timeline.