Machine Mayhem
Wow. Crazy week. So to get the bird’s eye view over the project and it’s numerous components, please check out our Machine Week page. To summarize, we decided to create a machine which shapes apples. Here I will give some more detailed information on my contribution: the UI component and “toolpathing”.
First Prototype
After we brainstormed possible UI/UX approaches, including hand-drawing curves, importing 2d or even 3d graphics, I wanted to to rapidly set up a prototype. The goal was that once the mechanical and electronics team are ready with a machine, we could already have a comfortable UI to test it out. Joao quickly made some UI sketches which I used for inspiration.
I started by copying over an three.js example. three.js is a powerful JavaScript library for 3D generation and interaction. This example had two features that I thought would come useful: orbit controls (using the mouse to move around the camera) and raycasting (eventually I didn’t use this feature, but I planned to originally).
Next, I wanted to create a shape with rotational symmetry, based on a curve. Luckily, three.js has a function that does exactly that, called LatheGeometry. I deleted the rugged terrain from the above example and added the following piece of code, based one the LatheGeometry example from “Learning Three.JS” book:
points = [];
//segments determines how many segments around the axis (core) of the apple we generate — fewer segments gives you a more cubic-looking apple
var segments = 24;
var count = 30;
for (var i = 0; i < count; i++) {
    points.push(new THREE.Vector3((Math.sin(i * 0.2) + Math.cos(i * 0.3)), 0, ( i - count ) + count / 2));
}
var latheGeometry = new THREE.LatheGeometry(points, segments);
var latheMaterial = new THREE.MeshBasicMaterial( { color: 0xe40510, wireframe: true} );
latheMesh = new THREE.Mesh( latheGeometry, latheMaterial )
scene.add(latheMesh);
As you can see, the following code draws a sinusoidal function:
I took more inspiration from that example, and used dat.gui - a three.js plug-in that allows to easily add user-configurable parameters. So my new function to generate the curve is:
And adding those parameters to dat.gui panel is as easy as:
var shapeFolder = gui.addFolder(`Design with Sin/Cos`)
shapeFolder.add(API, 'alpha').min(0.0).max(2.0).step(0.05).name( 'Sine Coef.' ).onChange( generateSineCosinePoints );
shapeFolder.add(API, 'beta').min(0.0).max(2.0).step(0.05).name( 'Cosine Coef.' ).onChange( generateSineCosinePoints );
shapeFolder.add(API, 'offset').min(-5).max(5).step(0.25).name( 'Offset (*PI)' ).onChange( generateSineCosinePoints );
shapeFolder.add(API, 'range').min(0.25).max(10.0).step(0.25).name( 'Range (*PI)' ).onChange( generateSineCosinePoints );
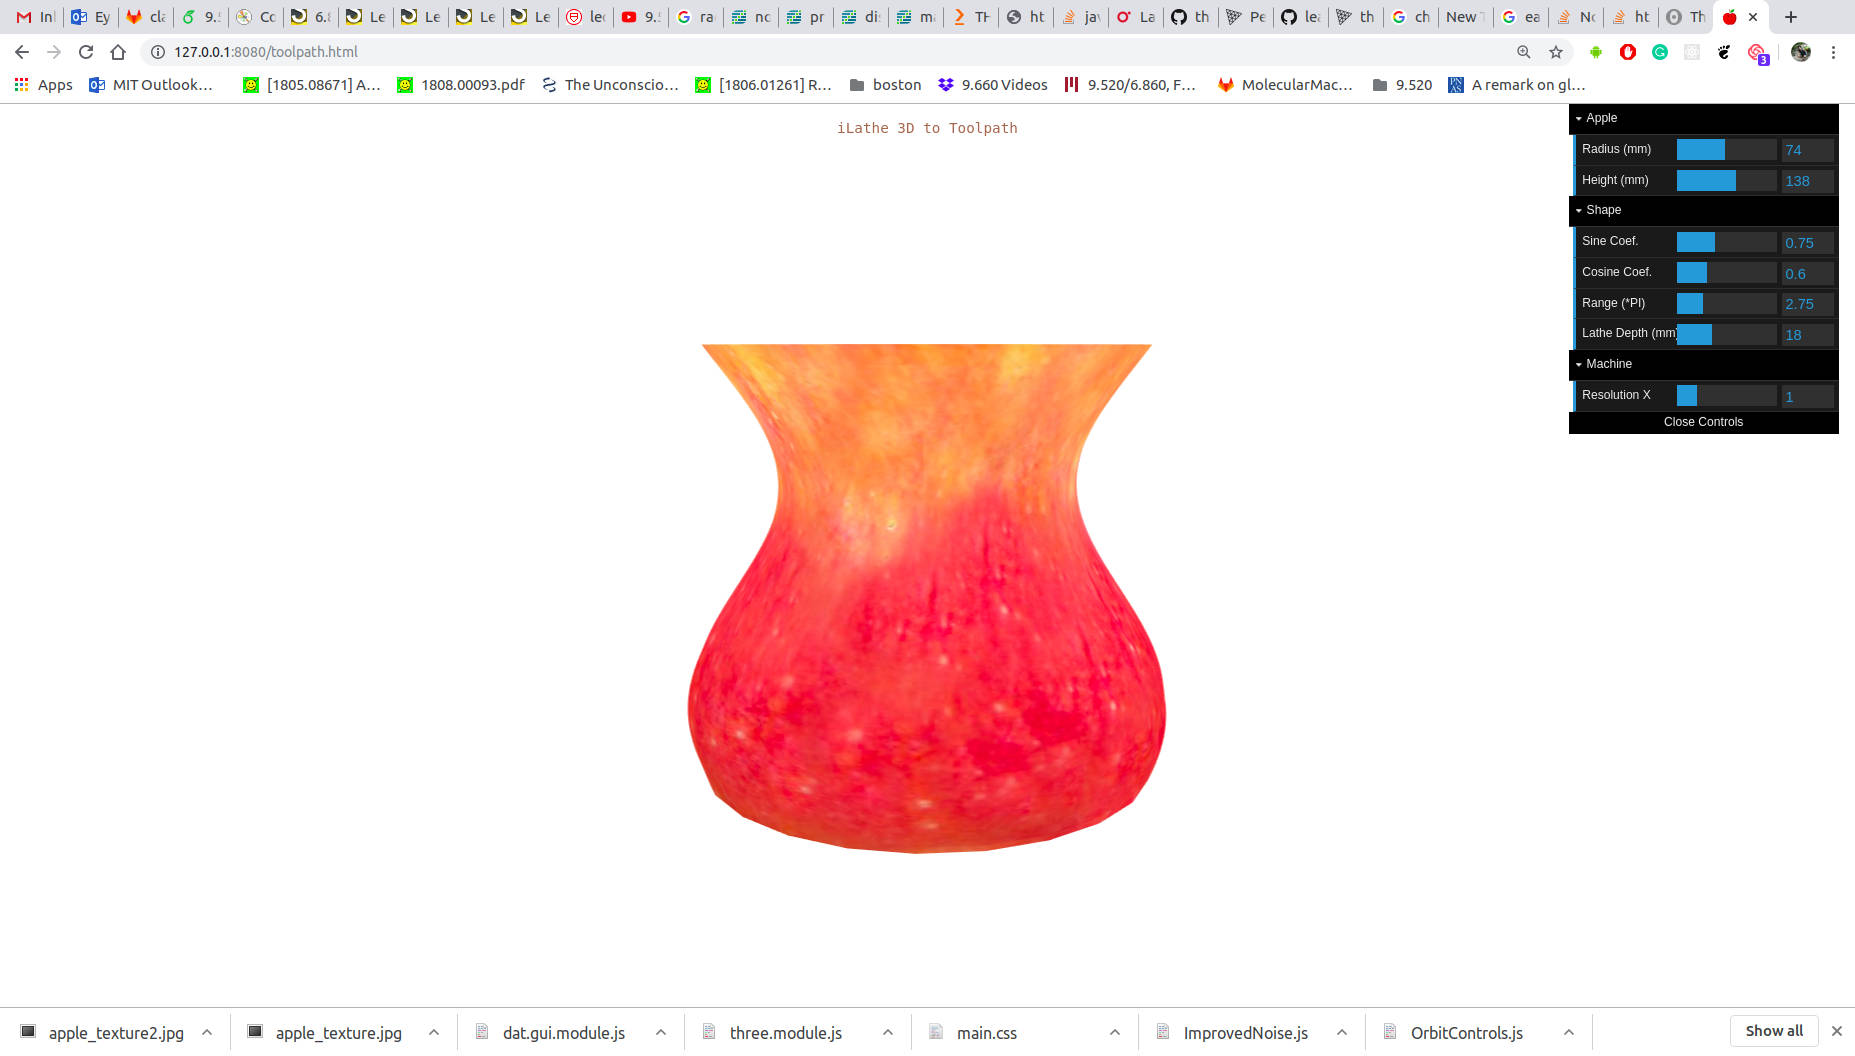
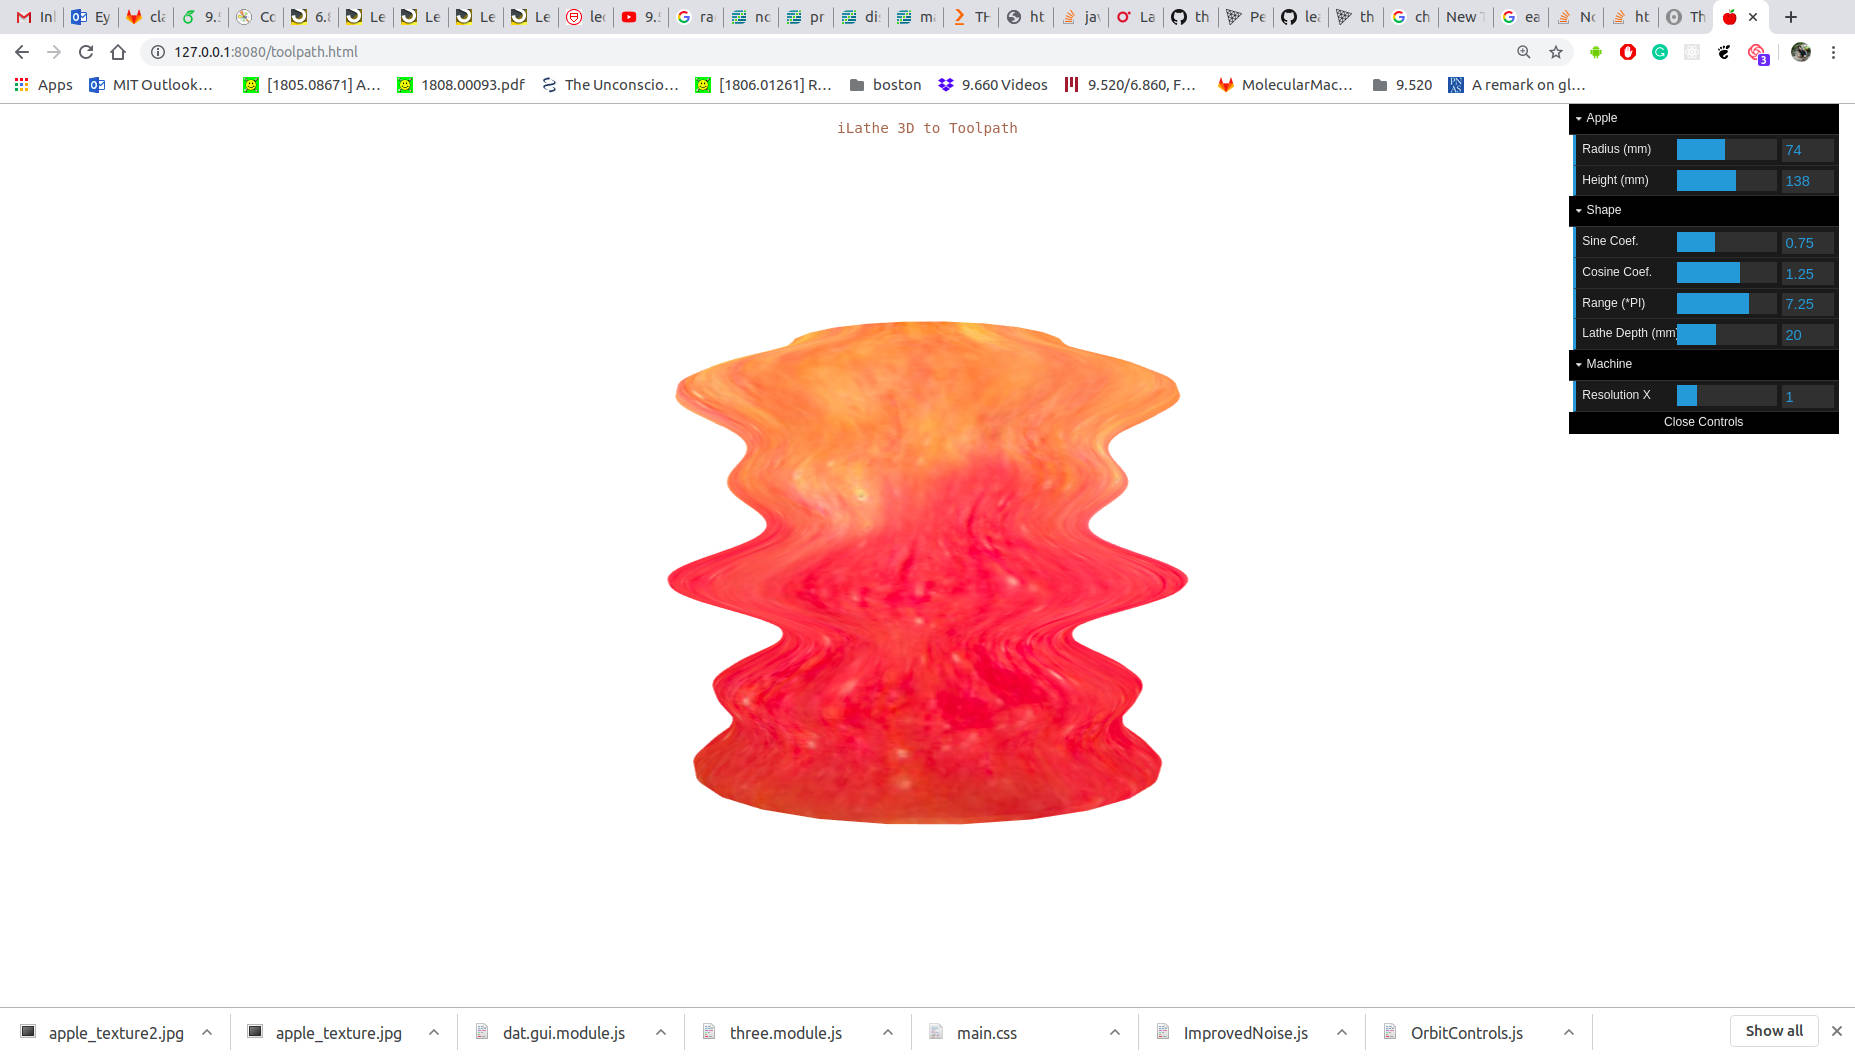
Finally, to make everything a bit prettier, I downloaded an apple texture and put it on the mesh by replacing latheMaterial with:
loader = new THREE.TextureLoader();
latheMaterial = new THREE.MeshBasicMaterial({
  map: loader.load('./assets/apple_texture.jpg'),
  side: THREE.DoubleSide
});
Isn’t three.js fun?
This setup allowed me to quickly create a wide variety of interesting apples:

Toolpathing
Next, we needed the UI to not only look pretty but also be useful. While finding the optimal toolpath for a given shape is not so trivial, there is a trivial toolpath for every smooth sinusoidal function. I define a constant step size at X, and a number of passes N. Then at every point of the function, location the tool needs to go to is:
(Assuming (0,0) is calibrated at the max radius of the apple and base of it).
The code itself is a bit more complicated because of normalization stuff. But still:
// each point is normalized for the depth of the cut between 0 and 1
var normalizedPoints = points.map(function (v, idx) {
  return API.maxmin * (1 - v[1]);
})

var startPosition = [0, 0];
var numOfPasses = Math.floor(API.maxmin / API.stepY) + 1;
var xSteps = Math.floor(API.height / API.stepX) + 1;
console.log("Number of passes: ", numOfPasses)
console.log("Number of steps: ", numOfPasses * xSteps)
var rotations = 0;
for (var i = 0; i < numOfPasses; i++) {
  for (var j = 0; j < xSteps; j++) {
    var x = (up ? j : (xSteps - j - 1));
    var y = normalizedPoints[x] * i / numOfPasses;
    rotations += API.rotations;
    toolpathPoints.push([x * API.stepX, y * API.stepY, rotations])
  }
  up = !up;
}
Notice that in our toolpath, we also send Z, the number of rotations per step. For our first version this was meant to be constant, but later we could use the same scheme to define more complated movement of the rotary motor, allowing carving of non symmetrical shapes.
Drawing and even animating the toolpath wasn’t too hard thanks to three.js. I generate the whole toolpath at once, but then at every animation frame I only draw the first M steps of the path, and I increase this M every animation loop until it reaches the total number of steps.
function drawPath(toolpathAnimationFrame) {
	var p = toolpathPoints.slice(lastAnimationFrame, toolpathAnimationFrame + 1  )
  .map(function(ar, idx) {
    return new THREE.Vector3(ar[0], ar[1], 0);
  })

  lastAnimationFrame = toolpathAnimationFrame;

	var geometry = new THREE.BufferGeometry().setFromPoints( p );
	var material = new THREE.LineBasicMaterial( { color: 0x0000ff } );

	var toolpathLine = new THREE.Line( geometry, material );
  // place the line correctly
  toolpathLine.rotation.z = Math.PI;
  toolpathLine.translateY((-(API.diameter + API.maxmin)) / 2);
  toolpathLine.translateX(-API.height / 2);
	scene.add( toolpathLine );
  toolpathLines.push(toolpathLine);
}

function animate() {
	requestAnimationFrame( animate );

  if (toolpathAnimationFrame != lastAnimationFrame && toolpathAnimationFrame < toolpathPoints.length) {
    drawPath(toolpathAnimationFrame);
    toolpathAnimationFrame += toolpathAnimationStep;
  }

	render();
}
And how it looks like:
Hand-Drawing
While I really liked the sinusoidal functions, we realized a more intuitive UI would be to draw a curve. While three.js is awesome, I couldn’t find an easy example which allowed me to draw in 2-dimensional on top of a 3d scene. I’m sure it’s possible though, yet I decided to go for a different hack. HTML5 Canvas is a perfect tool to use for 2D sketching, and there’s lots of examples online of short code for doing that. I based my code on this example. The trick is that there is an hidden canvas element, and when you enable handdraw mode, we display it so every mousedown event is now captured by the canvas rather than the 3d scene.
Getting from a handdrawing to a an evenly sampled curves was not trivial, and it’s still a bit buggy for certain user inputs. It worked by moving a sliding window over X and getting the average (normalized) Y for every window:
//numFinalPoints: the final number of points is the height of the apple divided by the size of the X (horizontal step) + 1 (to avoid a 0 result)
var numFinalPoints = Math.floor(API.height / API.stepX) + 1
//minY/minX: the reduce function sets the initial value of min to the first y value in the set, then checks each y and updates the min value, ultimately returning the minimum in the array
var minY = tempPoints.reduce((min, p) => p.y < min ? p.y : min, tempPoints[0].y);
var maxY = tempPoints.reduce((max, p) => p.y > max ? p.y : max, tempPoints[0].y);
console.log(minY, maxY);

//factor: the number of points we have from the hand-drawn line divided by the final number of points we want
var factor = tempPoints.length / numFinalPoints;

//flip: boolean that is TRUE if the original line goes Left to Right (if the first point in the line is smaller than the last point)
var flip = tempPoints[0].x < tempPoints[tempPoints.length - 1].x;

// sort the user drawn points by X
tempPoints.sort(function(p1, p2) {
  return p1.x - p2.x;
})

points = [];

var windowStart = tempPoints[0].x;
var windowSize = (tempPoints[tempPoints.length - 1].x - tempPoints[0].x) / numFinalPoints;
// iterate through the user points using a sliding window. each new point is the average Y of all points in that window
var j = 0;
var k = 1;
for (var i = 0; i < numFinalPoints; i++) {
  // find the first hand drawn point in the window
  while (j < tempPoints.length && tempPoints[j].x < windowStart) {
    j++;
  }
  // find the last point in the window
  k = j;
  while (k < tempPoints.length && tempPoints[k].x <= windowStart + windowSize) {
    k++;
  }
  var sumY = tempPoints.slice(j, k + 1).reduce((sum, p) => p.y + sum, 0);
  // these are numbers between 0-1
  var x = 1 - (i / (numFinalPoints - 1));
  var y = 1 - (((sumY / (k + 1 - j)) - minY) / (maxY - minY))
  points.push([x,  y]);

  // advance the window
  windowStart += windowSize;
}

points.reverse();
Next, Cynthia helped me out by creating smoothing functions that make the curve look much nicer.
Connecting the Dots
To interface with the Apfelstruder, I had to send (and receive) messages through a cool JS plugin that Brian wrote, named AppleJack. For every type of message we agreed on a message format, documented it, and it was very easy to just send it from the UI. For example to send a toolpath step:
uiAppleJack.sendMessageToCuttlefish({
  messageType: 'step',
  x: toolpathPoint[0],
  y: toolpathPoint[1],
  rotation: toolpathPoint[2]
})
Or to receive progress information:
if (message.messageType == "stepsCompleted") {
  currentSteps = message.steps;
  toolpathAnimationFrame = currentSteps;
  if (currentSteps == totalSteps) {
    changeToIdle();
  }
}
The End
Throughout the “hackathon” I added and modified this code many times, and sadly didn’t document every thing. Yet, the basic features are still the one described above. All of the latest code (as well as commit history) are available at our repo.