Week 13 — Interface & Application Programming
Setting Up the Serial Port
This week, the assignment is to write an application that interfaces a user with an
input &/or output device that I made. At first, I thought that this week would be easier then the previous weeks' but I was very wrong.
My goal was to make this as simple as possible as I am traveling for thanksgiving.
Out of all the languages, I wanted to use Javascript and work on my skillset there.
After doing some research, I decided to set up a serial communication using p5.js sketch running in a local browser to my microcontroller from input week.
Nice graphic from a classmate from last year via the NYU Phyiscal Computing Lab.
This tutorial was really helpful in making sure I was doing everything correctly, so I recommend following along.

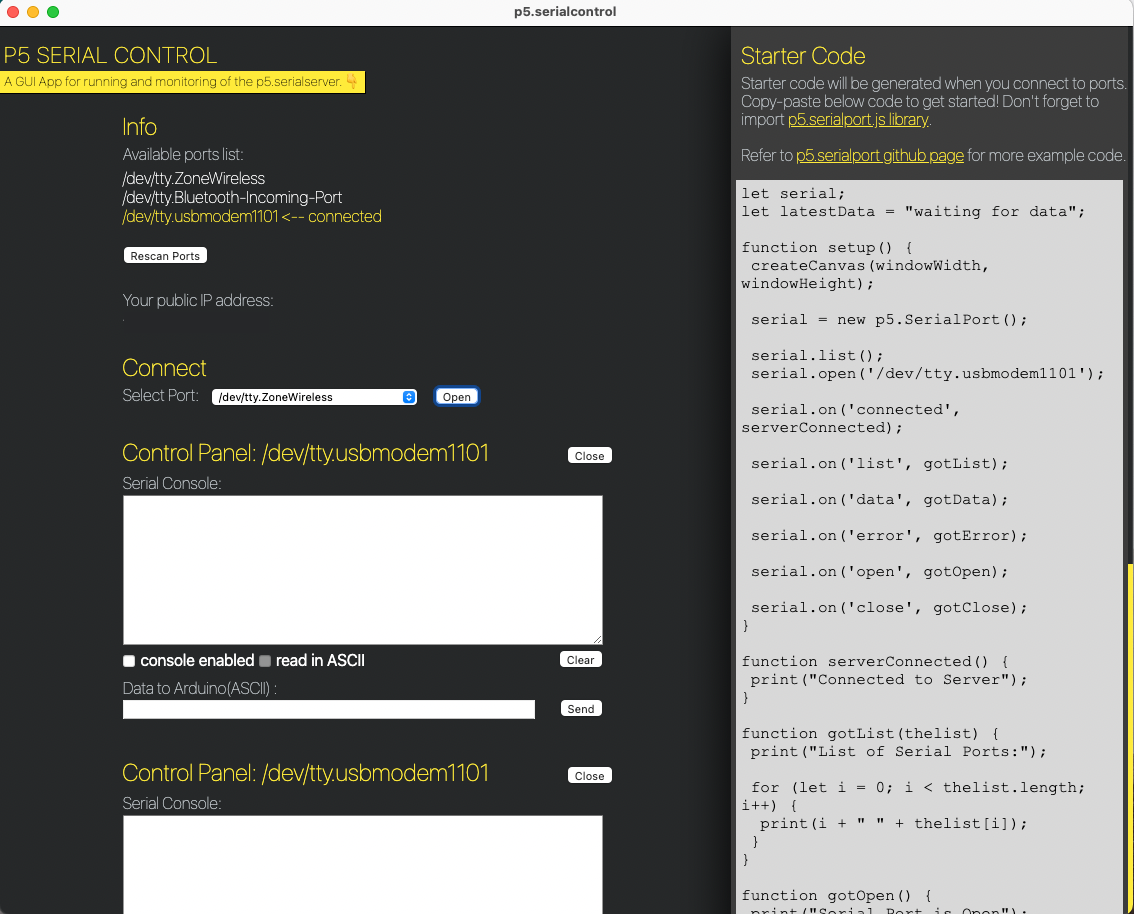
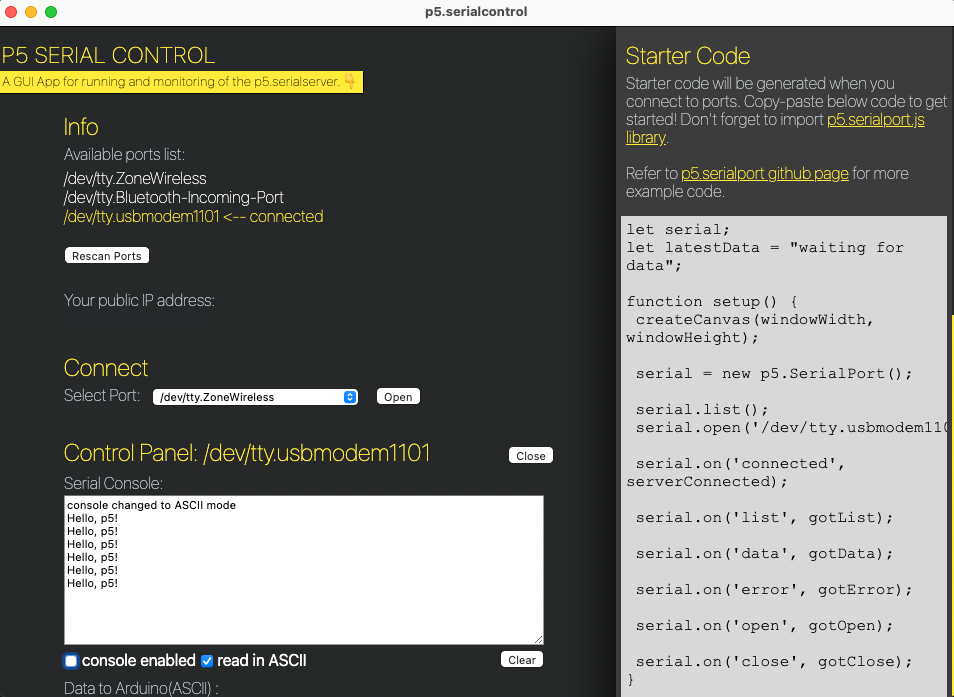
I downloaded p5.serial control, which you can find here. I plugged in my microcontroller and noted the port name. And it's open!
Testing Part 1 and 2
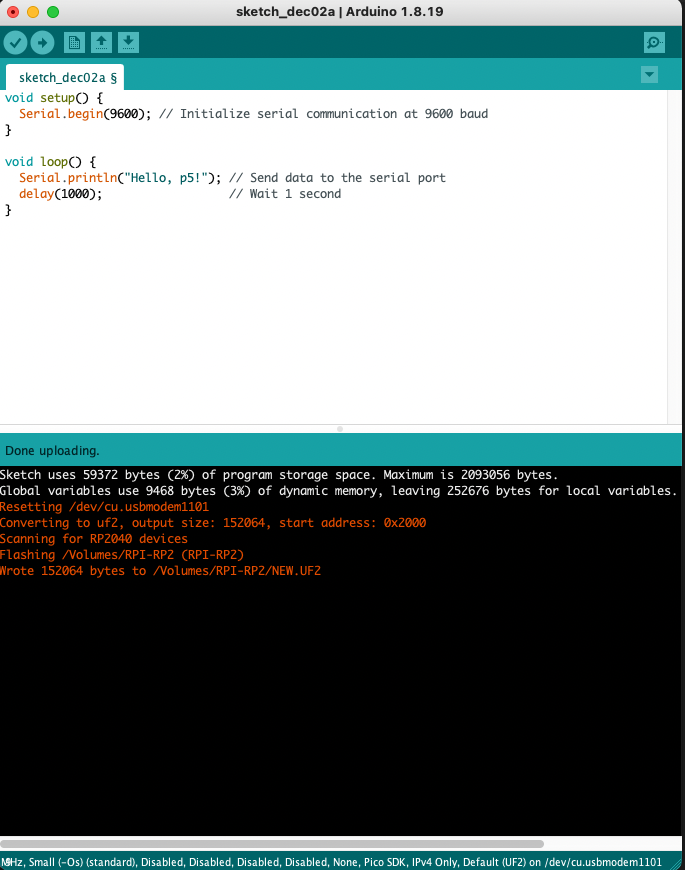
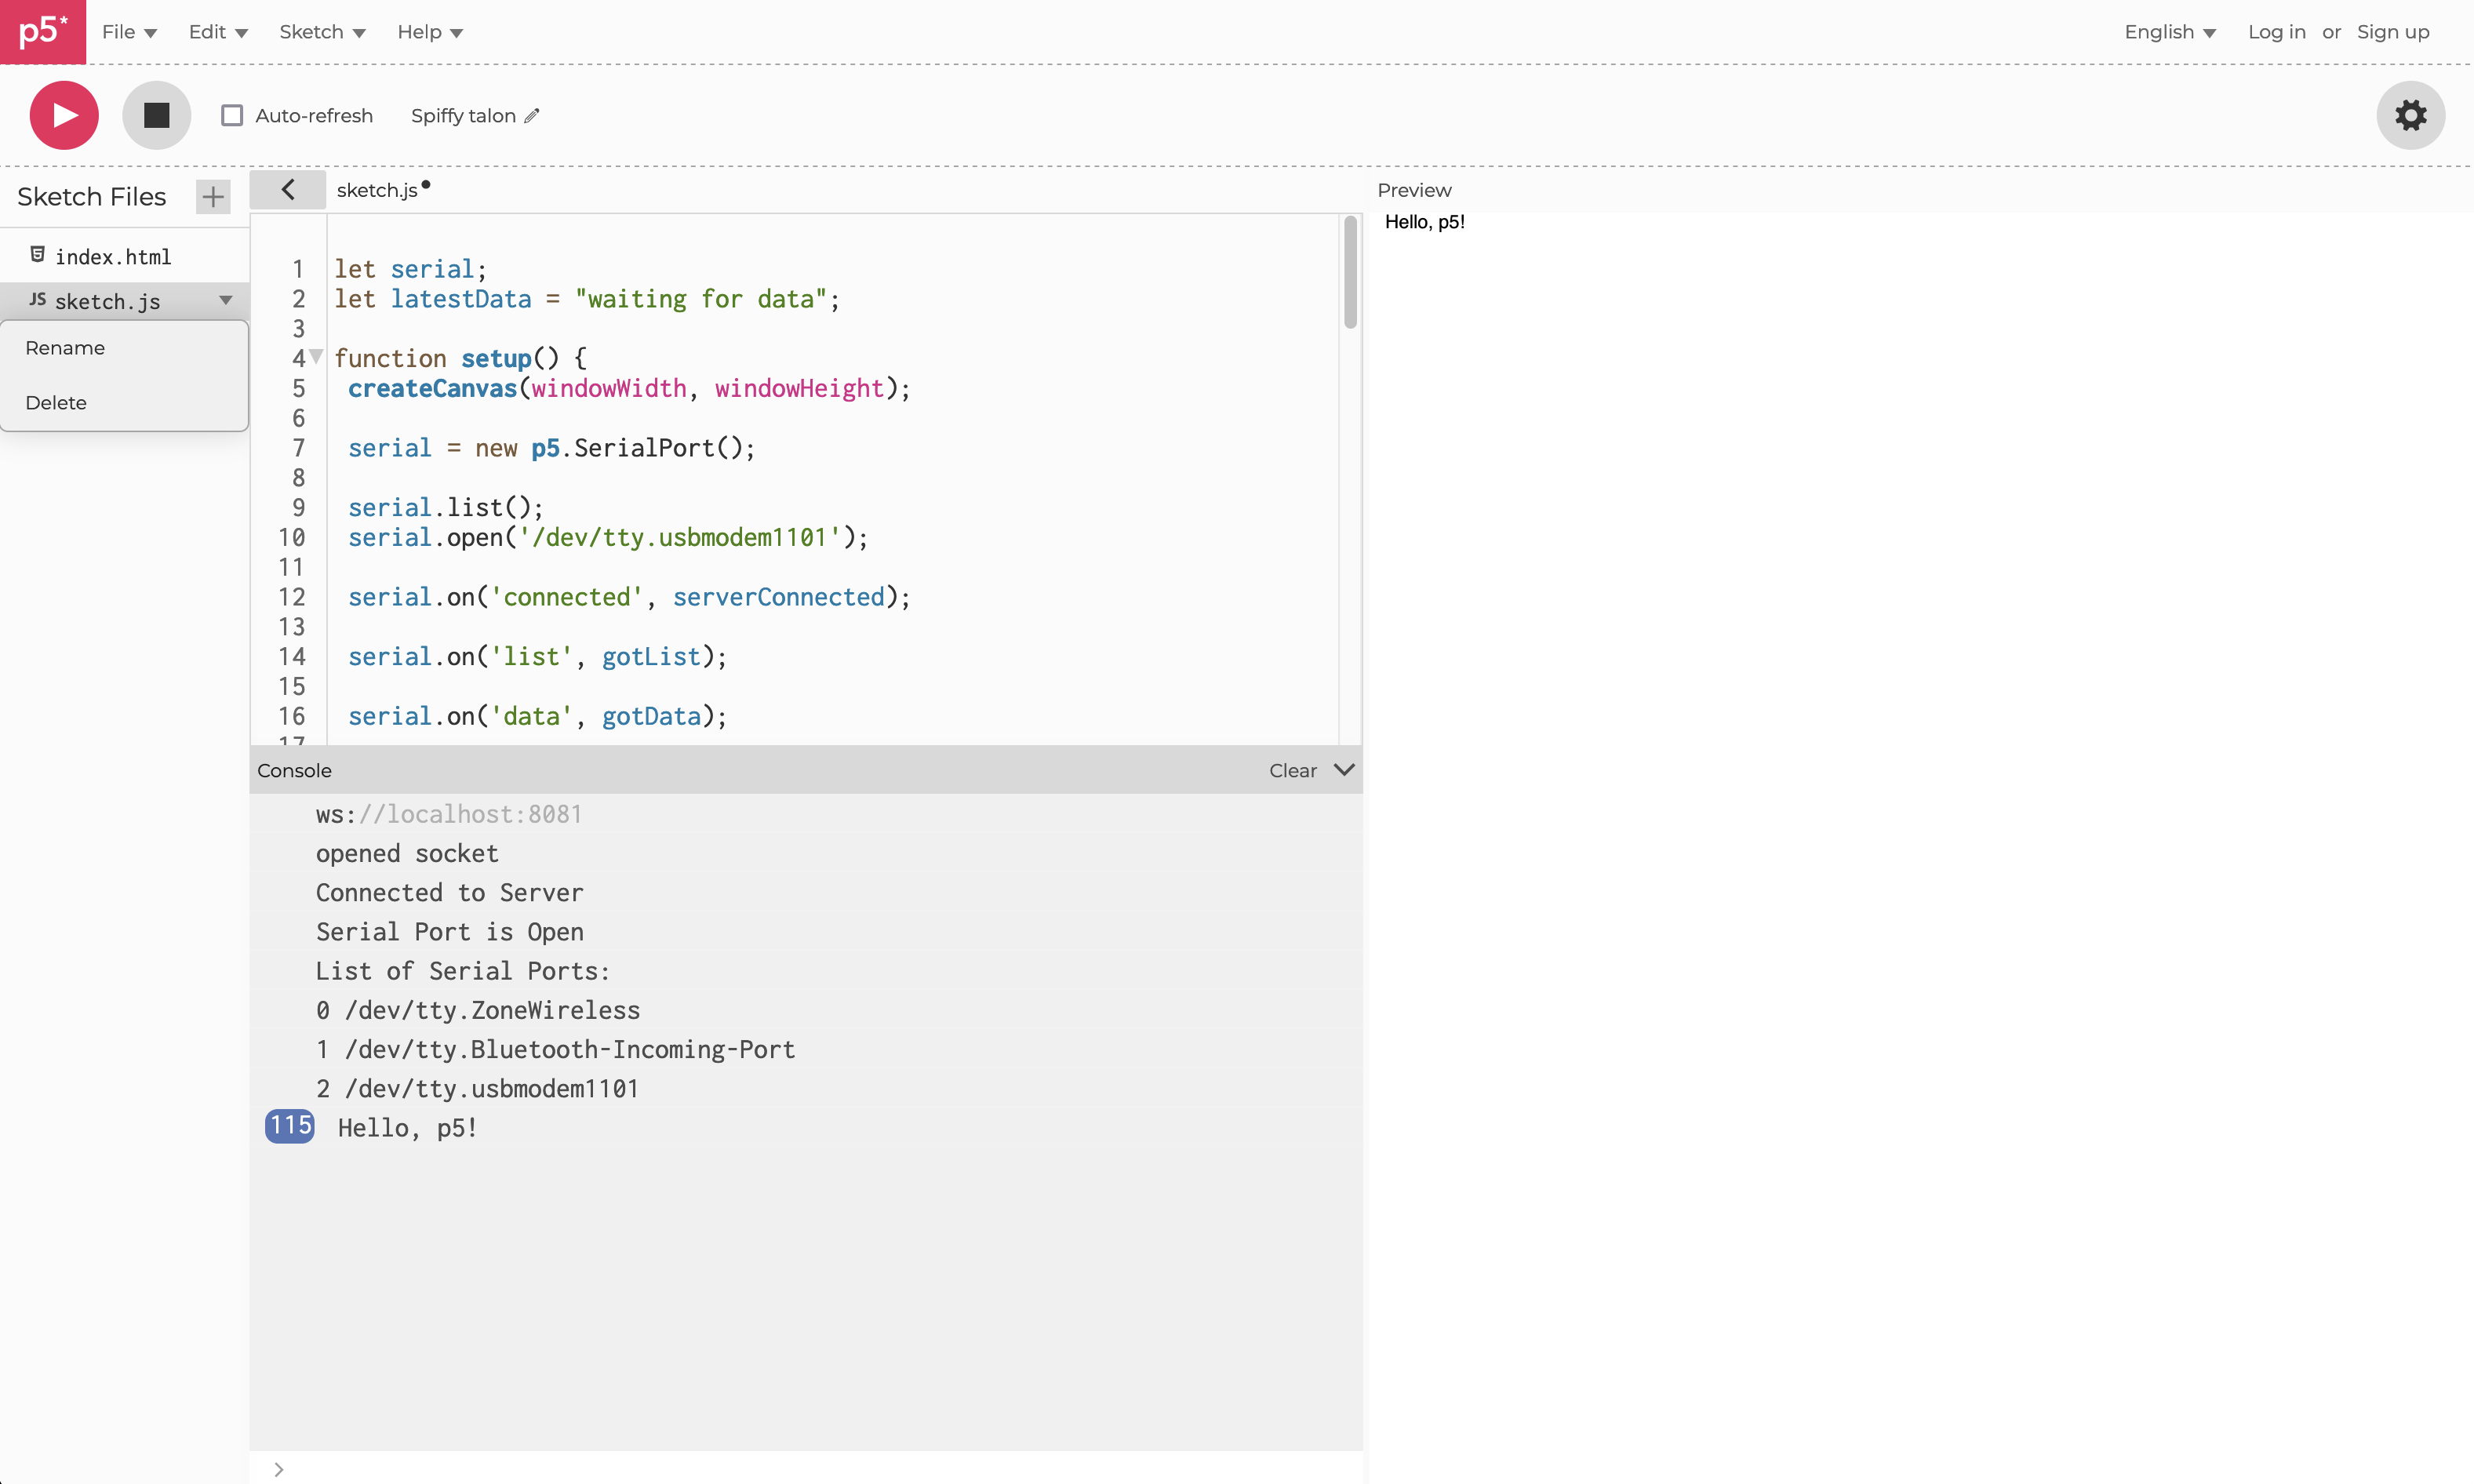
I wanted to make sure I understood the connection of the serial port to p5.js to using p5.serialcontrol. My first step was using a simple c++ code stating "hello, ps5"
and having it show up on the p5js web browser. You can't use the serial port in Arduino and the serialcontrol at the same time, so you need to make sure one is closed before opening the other.
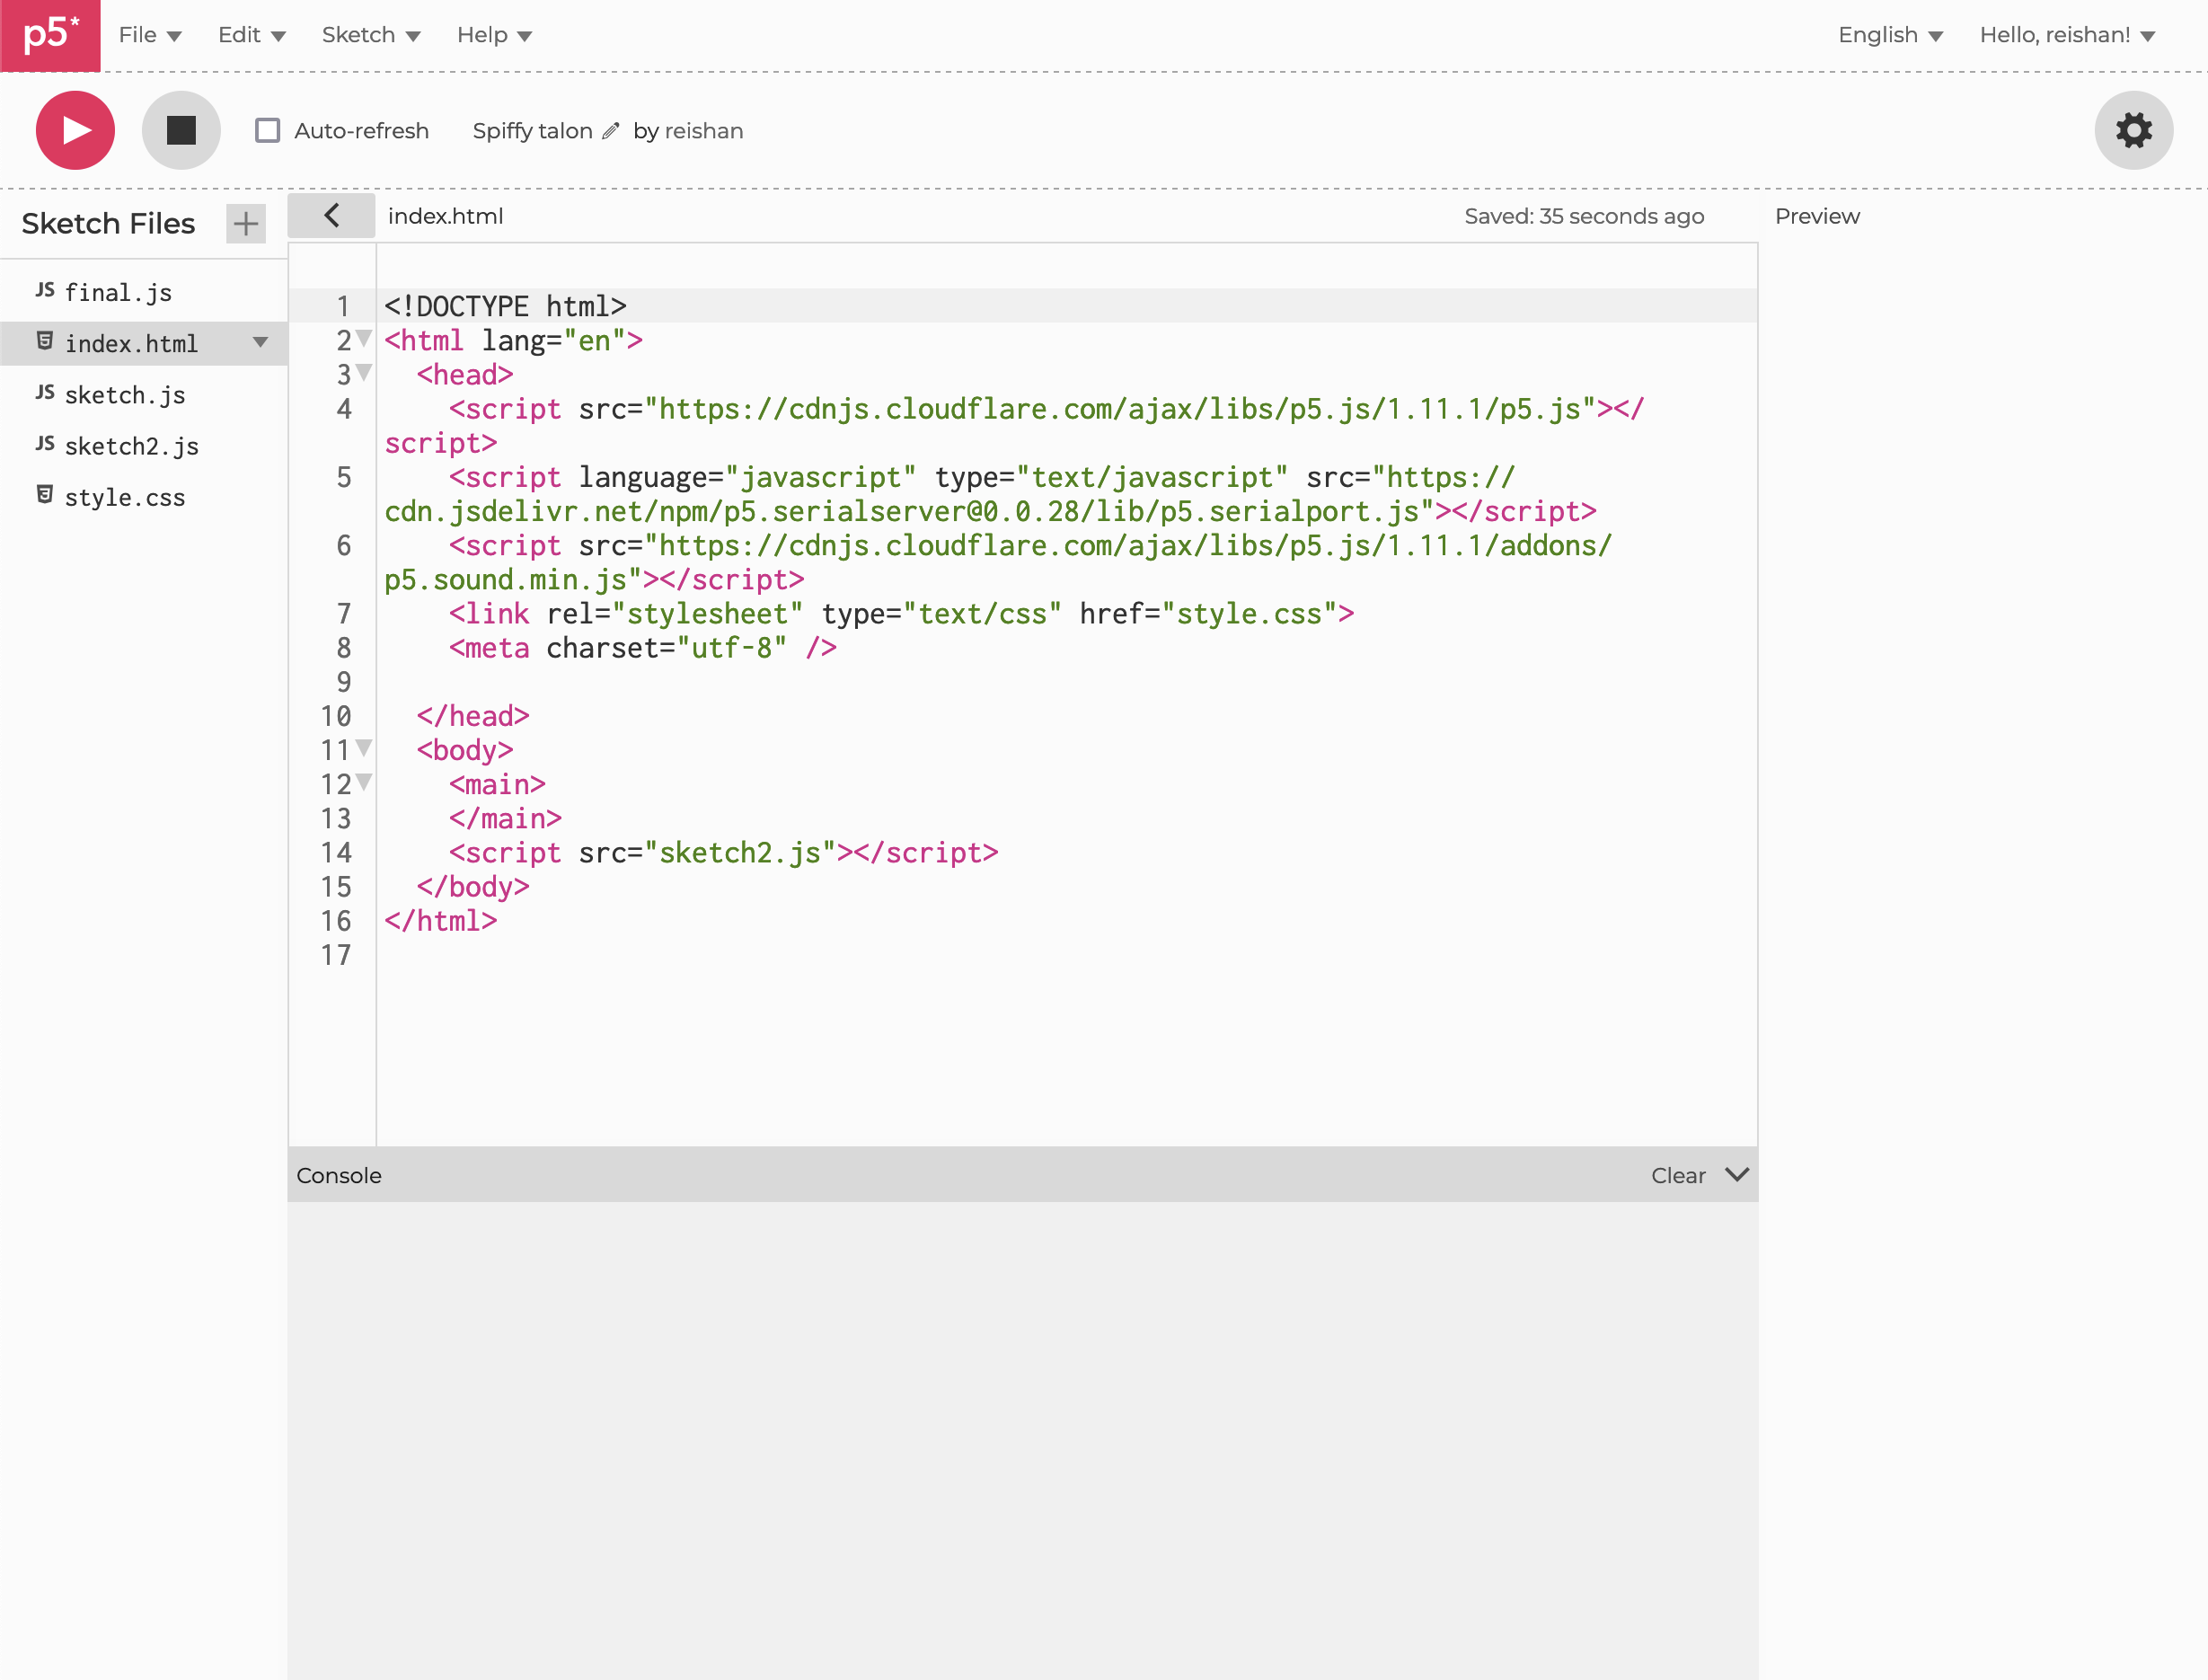
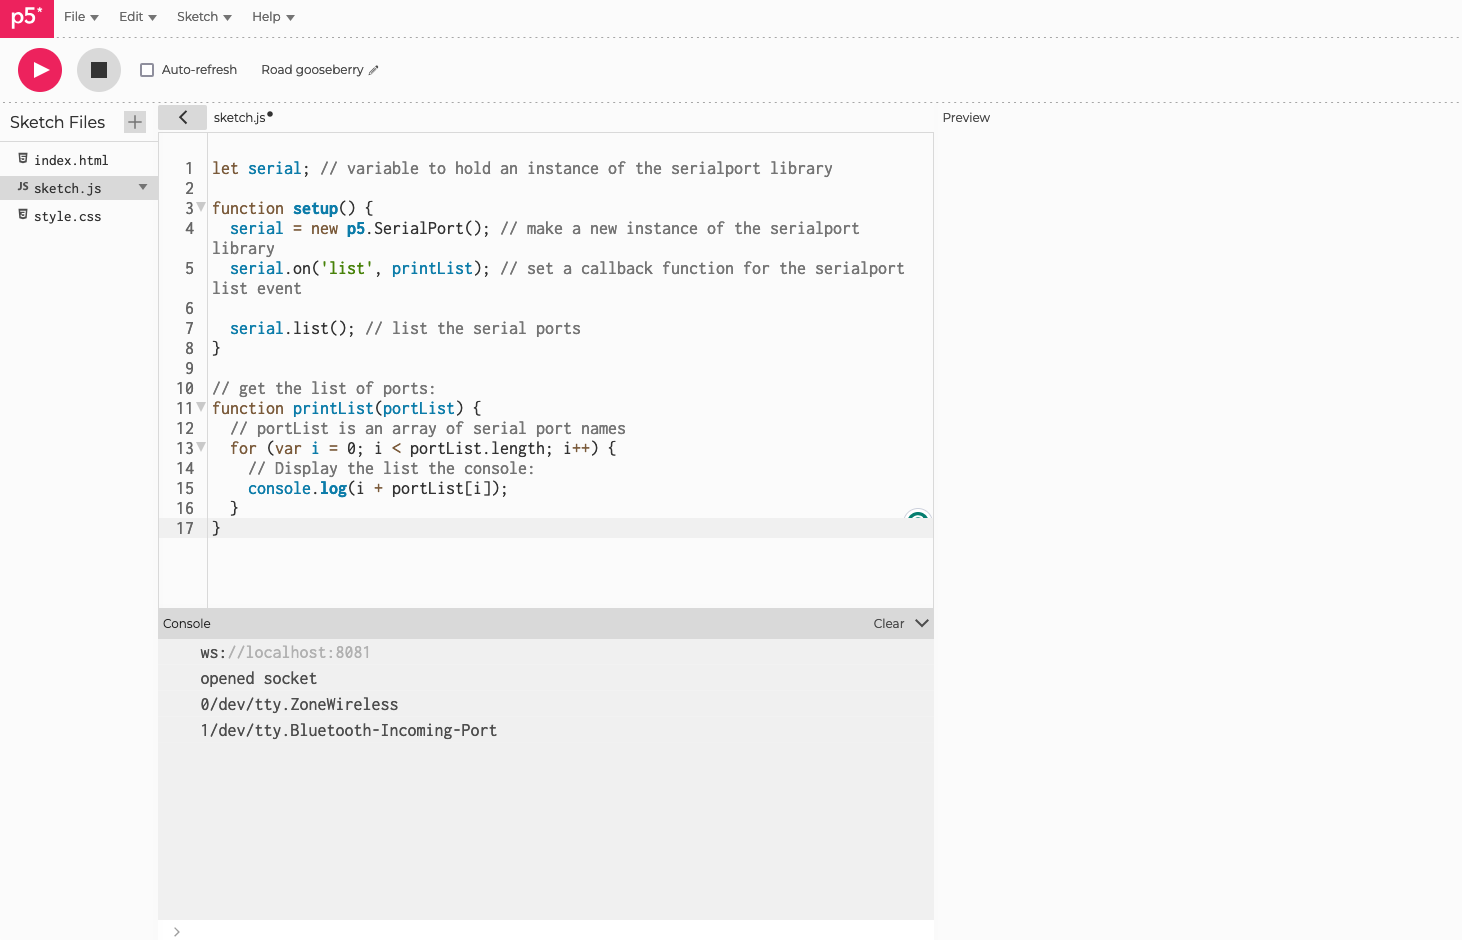
There are three main file components: the index.html file, the sketch.js file (using p5 web browser),and the C++ file (using Arduino). For the html file, you need to make sure it's reading from the serial port.
For the js file, you need to make sure the connection to the serial port is correct.
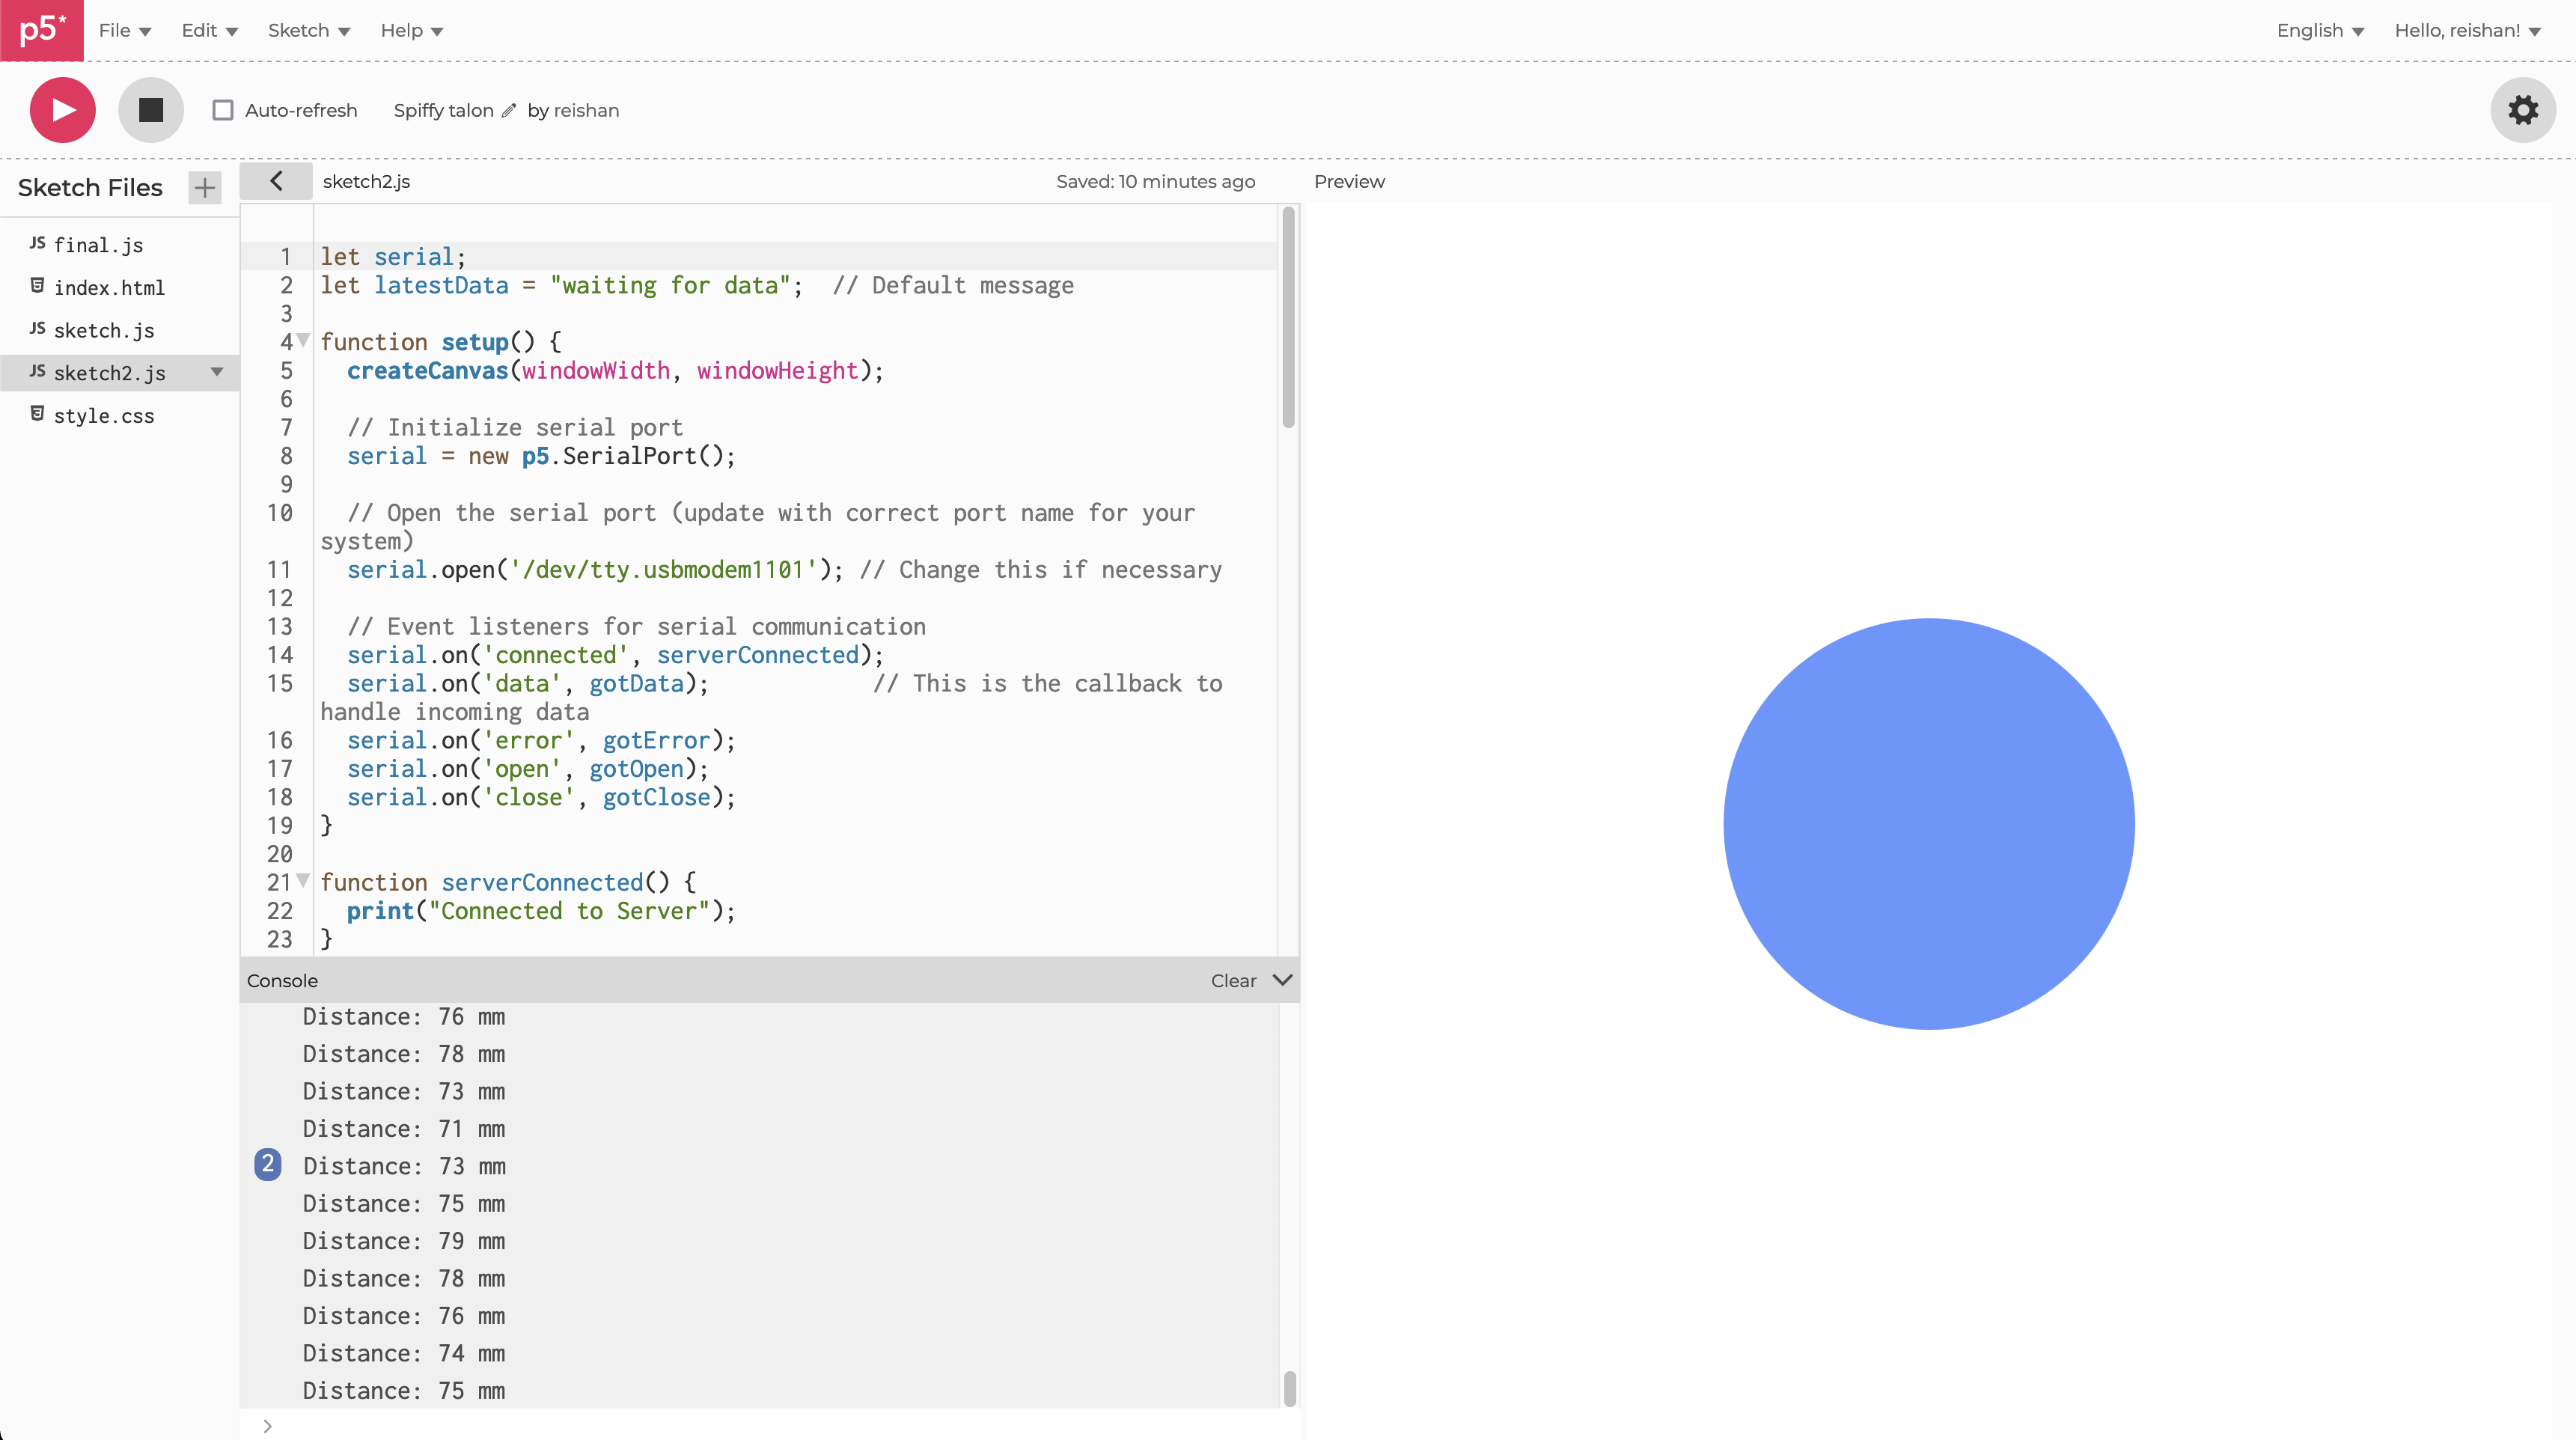
I ran a second test code using the data to make a circle larger or smaller.
I was having issues with Javascript reading my C++ language on the microcontroller, so I went back to the simple text that came with the sensor library.
You can see below that the JS needed to parse the distance number out from the output of the sensor in order to reflect on the circle. I used P5js online editor
to fiddle with the code which was easier then continually updating the JS on my local server.
    let serial;
    let latestData = "waiting for data";

    function setup() {
      createCanvas(windowWidth, windowHeight);

      // Initialize serial port
      serial = new p5.SerialPort();

      // Open the serial port
      serial.open('/dev/tty.usbmodem1101');

      // Event listeners for serial communication
      serial.on('connected', serverConnected);
      serial.on('data', gotData);
      serial.on('error', gotError);
      serial.on('open', gotOpen);
      serial.on('close', gotClose);
    }

    function serverConnected() {
      print("Connected to Server");
    }

    function gotOpen() {
      print("Serial Port is Open");
    }

    function gotClose() {
      print("Serial Port is Closed");
      latestData = "Serial Port is Closed";
    }

    function gotError(theerror) {
      print(theerror);
    }

    function gotData() {
      let currentString = serial.readLine(); // Read the incoming string
      currentString = trim(currentString);   // Clean up the string, removing extra spaces

      if (!currentString) return;             // Ignore empty strings

      console.log(currentString);             // Log the received string (for debugging)

      // Extract the distance value from the string "Distance:  mm"
      let distanceValue = currentString.match(/Distance:\s*(\d+)/);

      if (distanceValue) {
        let distance = int(distanceValue[1]);
        latestData = distance;

        // Map the distance to a range suitable for circle size
        let circleSize = map(distance, 0, 100, 200, 300);

        // Clear the screen and draw the circle with the mapped size
        background(255);  // Clear the screen every frame
        fill(100, 150, 255);
        noStroke();
        ellipse(width / 2, height / 2, circleSize, circleSize);  // Draw the circle
      }
    }
Final Output
Now that I have the process set up, I switched over to using the local htmaa server to set everything up.
Keeping with the circle, I added some gradiant and color to reflect the same aesethic as my landing page.
This time, javascript felt a lot easier to use and I was able to quickly get the visual I wanted.
I added text at the bottom to indicate distance measurement to make sure the sensor input was being read.
You can see the code below!
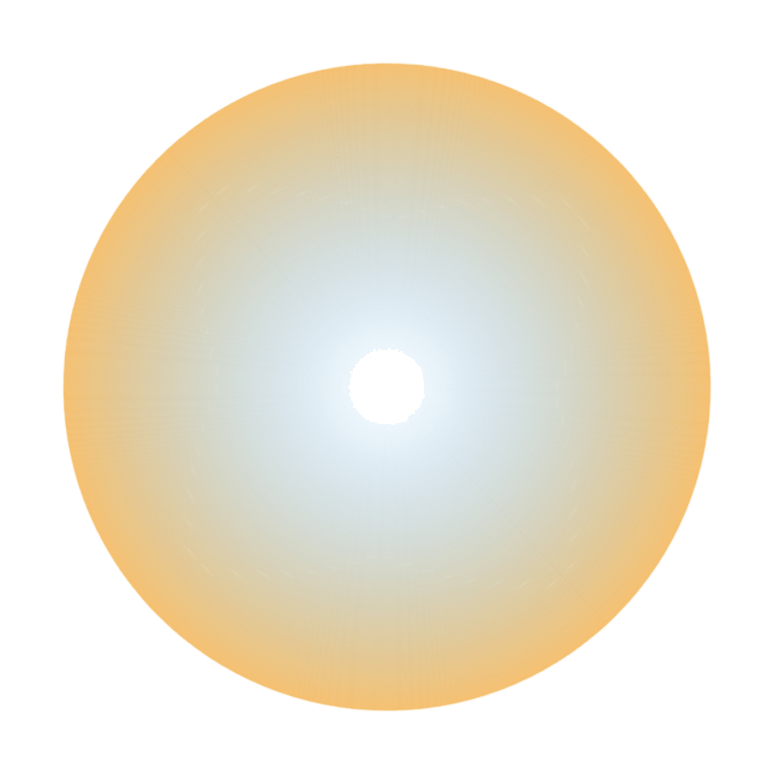
A better quality screen recording of the movements in action!
    let serial;
    let latestData = "waiting for data";
    let distance = 0;
    let smoothedSize = 0;

    function setup() {
      createCanvas(windowWidth, windowHeight);

      noScrollbars();

      serial = new p5.SerialPort();

      // Open the serial port
      serial.open('/dev/tty.usbmodem1101');

      // Event listeners for serial communication
      serial.on('connected', serverConnected);
      serial.on('data', gotData);
      serial.on('error', gotError);
      serial.on('open', gotOpen);
      serial.on('close', gotClose);

      textFont('Karla');
    }

    function serverConnected() {
      print("Connected to Server");
    }

    function gotOpen() {
      print("Serial Port is Open");
    }

    function gotClose() {
      print("Serial Port is Closed");
      latestData = "Serial Port is Closed";
    }

    function gotError(theerror) {
      print(theerror);
    }

    function gotData() {
      let currentString = serial.readLine(); // Read the incoming string
      currentString = trim(currentString);

      if (!currentString) return;

      console.log(currentString); // Log the received string

      // Extract the distance value from the string "Distance:  mm"
      let distanceValue = currentString.match(/Distance:\s*(\d+)/);

      if (distanceValue) {
        distance = int(distanceValue[1]);
      }
    }

    function draw() {
      background(255);

      // Map the distance to the gradient size
      let targetSize = map(distance, 0, 4000, 200, width * 1.5); // Adjust for sensor range
      smoothedSize += (targetSize - smoothedSize) * 0.1; // Easing factor (adjust 0.1 for speed)

      // Draw the gradient
      drawGradient(width / 2, height / 2, smoothedSize);

      // Display distance
      fill(0);
      textSize(12);
      textAlign(LEFT, BOTTOM);
      text("Distance: " + distance + " mm", 60, height- 60);
    }

    function drawGradient(x, y, size) {
      noFill();
      for (let r = size; r > 0; r -= 1) {
        let inter = map(r, 0, size, 1, 0); // Interpolation factor
        let startColor = color(255, 150, 0, 100); // Start of gradient (center)
        let endColor = color(0, 150, 255, 0); // End of gradient (edges)
        let c = lerpColor(startColor, endColor, inter); // Interpolated color
        stroke(c); // Use interpolated color as stroke
        ellipse(x, y, r, r); // Draw the gradient as concentric circles
      }
    }

    // Handle dynamic resizing of the canvas
    function windowResized() {
        resizeCanvas(windowWidth, windowHeight);
      }

    // Prevent scrollbars
    function noScrollbars() {

        let html = document.documentElement;
        let body = document.body;

        html.style.margin = '0';
        html.style.overflow = 'hidden';
        html.style.padding = '0';
        html.style.height = '100%';

        body.style.margin = '0';
        body.style.overflow = 'hidden';
        body.style.padding = '0';
        body.style.height = '100%';
      }
click here for the html location!