HOW TO MAKE (ALMOST) ANYTHING
MAS.863 / FALL 2011
KELLY SHAW
M.ARCH LEVEL III
03 / PCB DESIGN, FABRICATION, AND ASSEMBLY
04 / WATERJET CUTTER AND CNC MILLING
11 / INTERFACE AND APPLICATION PROGRAMMING
12 / MECHANICAL AND MACHINE DESIGN
13 / NETWORKING AND COMMUNICATIONS
WEEK 11 / INTERFACE & APPLICATION PROGRAMMING
Slightly overwhelmed by the variety of possible programming languages and interfaces, I opted to use
Arduino & Processing as my platform for building a visualizer to accompany the IR proximity sensor
I had created in Week 09. I decided to leave the LED lights on the board since it would be a good way to
check if the sensor and board were acting up.
VISUALIZING SENSOR OUTPUT
The IR proximity sensor was outputting numbers where the closer you were to the sensor, the higher
the numbers were:
[SERIAL MONITOR PRINTING SENSOR OUTPUT]
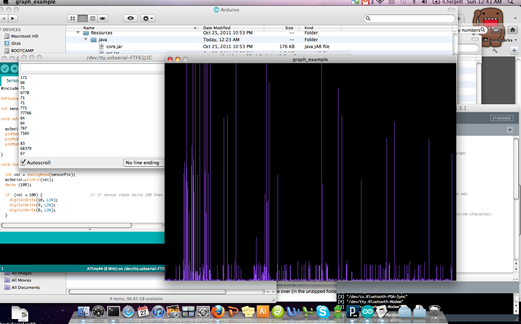
To visualize the output graphically and to get a better handle on using Processing, I ran the sample Graph
code with my sensor:
[GRAPHICAL VISUALIZATION OF SENSOR OUTPUT]
I discovered I couldn't run both the Arduino Serial Monitor and the Processing windows simultaneously
without getting very noisy readings. I think it may have had something to do with the power needed to
run both applications?
[noisy simultaneous output]
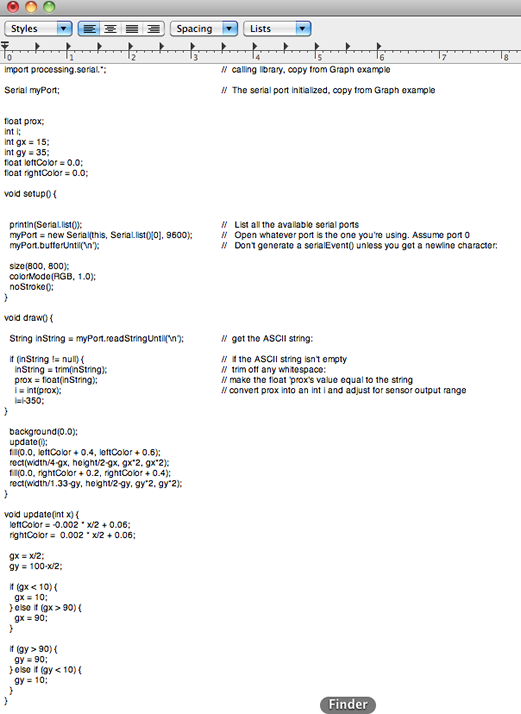
To play with more visual outputs I took a Processing example which created different size
colored squares in 1D based on mouse button input and replaced it with the output from the proximity
sensor. In this case, the closer your hand is to the sensor, the smaller and brighter the square on the
right will be. As you pull your hand farther away, the left square reflects the inverse, getting smaller and
more lightly colored.
[COLORED SQUARE VISUALIZATION]
Code:

Insanely simple to some...SUPER fun to me :).
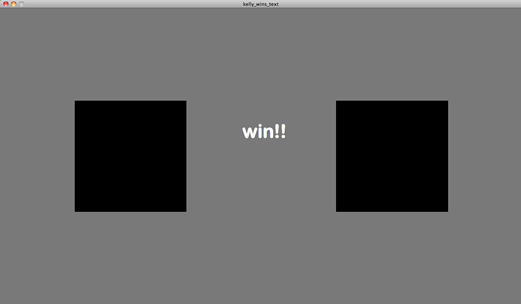
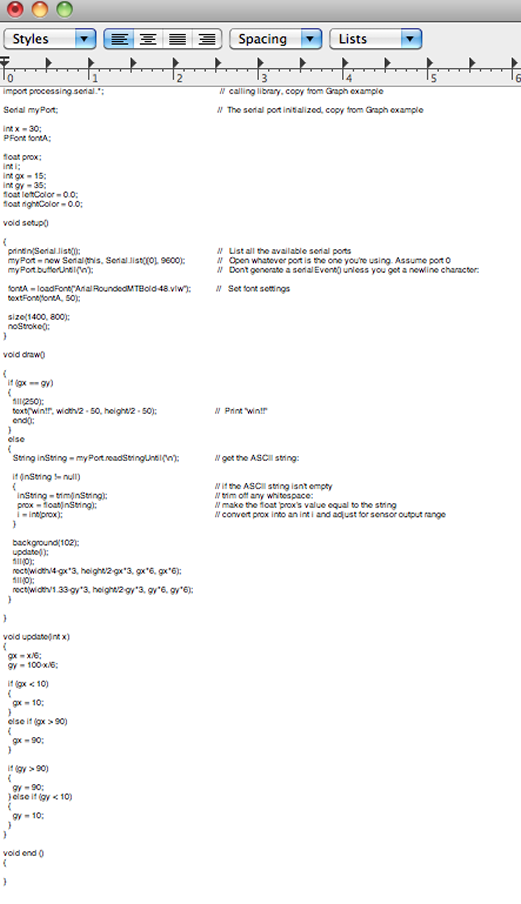
02. MAKING SOMETHING FUNI decided I wanted to create a game out of trying to match the shapes with the proximity sensor. In the
game, the two squares scale differently relative to the distance your hand is from the sensor. If you can
match the two squares, you win!
[SQUARE MATCHING GAME]
Code:


