(1) As an intro, I learned how to read serial data into Unity and how to adjust a game object in response. I also created a button to send an output.
(2) I learned to use Javascript, specifically Chart.js to read data from a serial port and live plot it using chart.js
First I followed Diego's tutorials on interfacing with Unity.
First I followed his instructtions for setting up the Serial Communication C# script. This script is what allows Unity to receive data incoming from a serial port. The first step for this was a little "hello world" showing that we get this script talking to the unity console.
This hellow world then appears in the unity project console! This is what will happen with the serial data.
This is what the overall project looks like, you can create folders for your images, other files, and your script.
Next I made a game object out of a transparent UFO button that I found via google images. I added text to this button with the though that this button could go in my eventual GUI that controls my final project's sensor readings.
This button is contrlled via the serial com script that Diego's tutorial introduced. In his code this script changes the size of a sphere in responce to a sensor's inputs.
After setting up this interface I felt comfortable setting up a serial com port to an interface, but I wanted to explore another avenue. As first I though I would use Unity and I found some exisiting projects to play around with:
Unity was alright, but I realized it was definitiely overkill for creating a data visulation interface for my final project.
All of the three.js examples in class were really beautiful, so I set about learned to make an interface with javascript.
I found a really helpful tutorial that really helped me set up Node.js and Chart.js. Here is the tutorial
Setting up Node.js and Chart.js:
1. Create new folder for project
2. Go to a directory where you want to create this app and create a new folder and navigate to that folder in terminal / command prompt / powershell. now type npm init to create a new Node.js app and fill up all the details.
3. Run “npm install express socket.io serialport --save” to install express, socket.IO and serialport libraries
4. Create index.js files
A. I pasted the following code from the example site. This creates an Express server, then connects us to the serial port.
var express = require('express');
var app = express();
var server = app.listen(4000, () => { //Start the server, listening on port 4000.
console.log("Listening to requests on port 4000...");
})
var io = require('socket.io')(server); //Bind socket.io to our express server.
app.use(express.static('public')); //Send index.html page on GET /
const SerialPort = require('serialport');
const Readline = SerialPort.parsers.Readline;
const port = new SerialPort('COM3'); //Connect serial port to port COM3. Because my Arduino Board is connected on port COM3. See yours on Arduino IDE -> Tools -> Port
const parser = port.pipe(new Readline({delimiter: '\r\n'})); //Read the line only when new line comes.
parser.on('data', (temp) => { //Read data
console.log(temp);
var today = new Date();
io.sockets.emit('temp', {date: today.getDate()+"-"+today.getMonth()+1+"-"+today.getFullYear(), time: (today.getHours())+":"+(today.getMinutes()), temp:temp}); //emit the datd i.e. {date, time, temp} to all the connected clients.
});
io.on('connection', (socket) => {
console.log("Someone connected."); //show a log as a new client connects.
})
B. My instance of serialport is COM18 for the USB connection to my board.
C. Then I set up a parser to read the data from the serial port. The delimiter is ‘/n’.
5. Create the files that will plot the data in a new public folder, I call mine index.html
A. Now I can take advantage of the wide range of available javascript libraries
B. We will use the Chart.js library, install it will the git bash command: “npm install chart.js --save”
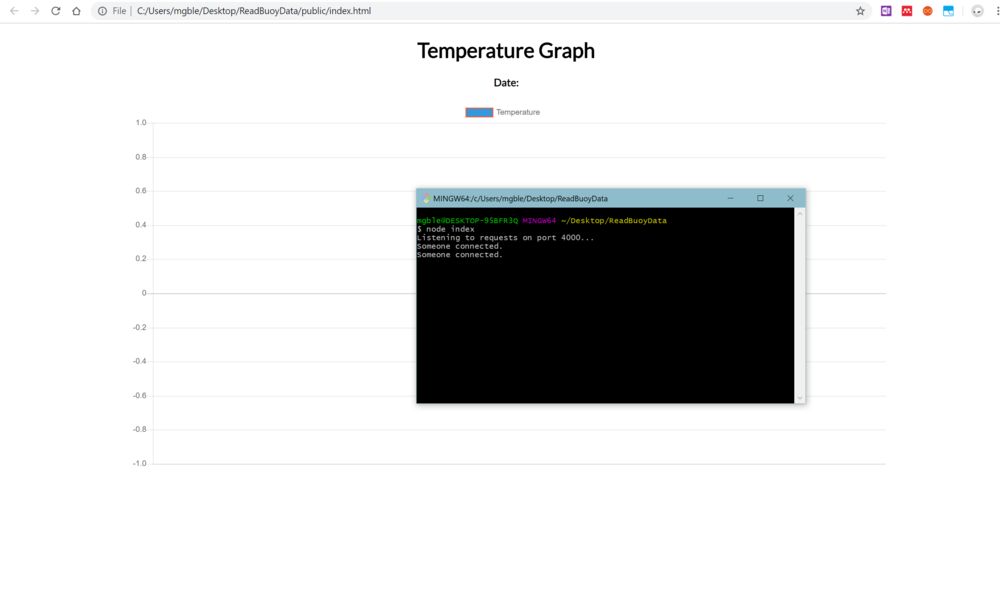
For my interface, I start with an example that appeared like this:
Temperature Plot
Data
Date:
This is the cooresponding code:
<html>
<head>
<title>Temperature Plot</title>
<meta name="viewport" content="width=device-width, initial-scale=1.0">
</head>
<body>
<h1>Data</h1>
<h4>Date: <span id="date"></span></h4>
<div class="chart-container" style="position: relative; width:75vw; margin: auto;">
<canvas id="myChart"></canvas>
</div>
<link href="https://fonts.googleapis.com/css?family=Lato" rel="stylesheet">
<script src="https://cdnjs.cloudflare.com/ajax/libs/Chart.js/2.4.0/Chart.min.js"></script>
<script src="https://cdnjs.cloudflare.com/ajax/libs/socket.io/2.0.4/socket.io.js"></script>
<script>
var socket = io.connect('http://localhost:4000'); //connect to server
var ctx = document.getElementById('myChart').getContext('2d');
var chart = new Chart(ctx, {
// The type of chart we want to create
type: 'line',
// The data for our dataset
data: {
labels: [],
datasets: [{
label: "Temperature",
borderColor: "#FF5733",
data: [],
fill: false,
pointStyle: 'circle',
backgroundColor: '#3498DB',
pointRadius: 5,
pointHoverRadius: 7,
lineTension: 0,
}]
},
// Configuration options go here
options: {}
});
socket.on('temp', function(data) { //As a temp data is received
console.log(data.temp);
document.getElementById('date').innerHTML = data.date; //update the date
if(chart.data.labels.length != 15) { //If we have less than 15 data points in the graph
chart.data.labels.push(data.time); //Add time in x-asix
chart.data.datasets.forEach((dataset) => {
dataset.data.push(data.temp); //Add temp in y-axis
});
}
else { //If there are already 15 data points in the graph.
chart.data.labels.shift(); //Remove first time data
chart.data.labels.push(data.time); //Insert latest time data
chart.data.datasets.forEach((dataset) => {
dataset.data.shift(); //Remove first temp data
dataset.data.push(data.temp); //Insert latest temp data
});
}
chart.update(); //Update the graph.
});
</script>
</body>
<style>
h1 {
text-align: center;
font-family: 'Lato', sans-serif;
}
h4 {
text-align: center;
font-family: 'Lato', sans-serif;
}
p {
text-align: center;
font-family: 'Lato', sans-serif;
}
</style>
</html>
For my project I will be displaying multiple datasets at once, so I need to modify this to accomodate that. I added code to parse data that is seperated by commas:
In order to display multiple graphs I need a new class division:
<div class="chart-container" style="position: relative; width:75vw; margin: auto;">
<canvas id="myChart2"></canvas>
</div>
I also need to define a new chart and a new ctx. After defining those I need to update the socket.on('temp', function(data) {} to update all the charts with new data.
After making all these changes, this was my final code:
<!DOCTYPE html>
<html>
<head>
<title>Buoy Data</title>
<meta name="viewport" content="width=device-width, initial-scale=1.0">
</head>
<body>
<h1>Buoy Data</h1>
<h4>Date: <span id="date"></span></h4>
<div class="chart-container" style="position: relative; width:90vw; margin: auto;">
<button onclick="ledSwitch()">Change Color</button>
<canvas id="myChart"></canvas>
</div>
<div class="chart-container" style="position: relative; width:90vw; margin: auto;">
<canvas id="myChart2"></canvas>
</div>
<div class="chart-container" style="position: relative; width:90vw; margin: auto;">
<canvas id="myChart4"></canvas>
</div>
<div class="chart-container" style="position: relative; width:90vw; margin: auto;">
<canvas id="myChart3"></canvas>
</div>
<link href="https://fonts.googleapis.com/css?family=Lato" rel="stylesheet">
<script src="https://cdnjs.cloudflare.com/ajax/libs/Chart.js/2.4.0/Chart.min.js"></script>
<script src="https://cdnjs.cloudflare.com/ajax/libs/socket.io/2.0.4/socket.io.js"></script>
<script>
var socket = io.connect('http://localhost:4000'); //connect to server
var ctx = document.getElementById('myChart').getContext('2d');
var ctx2 = document.getElementById('myChart2').getContext('2d');
var ctx3 = document.getElementById('myChart3').getContext('2d');
var ctx4 = document.getElementById('myChart4').getContext('2d');
var chart = new Chart(ctx, {
// The type of chart we want to create
type: 'line',
// The data for our dataset
data: {
labels: [],
datasets: [
{
label: "Red",
borderColor: "#ff4e4e",
data: [],
fill: false,
pointStyle: 'circle',
backgroundColor: "#ff4e4e",
pointRadius: 5,
pointHoverRadius: 7,
lineTension: 0.1,
},
{
label: "Green",
borderColor: "#84ba74",
data: [],
fill: false,
pointStyle: 'circle',
backgroundColor: "#84ba74",
pointRadius: 5,
pointHoverRadius: 7,
lineTension: 0,
},
{
label: "Blue",
borderColor: "#3c66f2",
data: [],
fill: false,
pointStyle: 'circle',
backgroundColor: "#3c66f2",
pointRadius: 5,
pointHoverRadius: 7,
lineTension: 0,
},
{
label: "White",
borderColor:"#a7a7a7",
data: [],
fill: false,
pointStyle: 'circle',
backgroundColor: '#a7a7a7',
pointRadius: 5,
pointHoverRadius: 7,
lineTension: 0,
showLine: true,
},
]
},
// Configuration options go here
options: {}
});
var chart2 = new Chart(ctx2, {
// The type of chart we want to create
type: 'line',
// The data for our dataset
data: {
labels: [],
datasets: [
{
label: "CCT",
borderColor: "#ffdf95",
data: [],
fill: false,
pointStyle: 'circle',
backgroundColor: '#ffdf95',
pointRadius: 5,
pointHoverRadius: 7,
lineTension: 0,
},
{
label: "AL",
borderColor: '#3498DB',
data: [],
fill: false,
pointStyle: 'circle',
backgroundColor: '#3498DB',
pointRadius: 5,
pointHoverRadius: 7,
lineTension: 0,
},
]
},
// Configuration options go here
options: {}
});
var chart3 = new Chart(ctx3, {
// The type of chart we want to create
type: 'line',
// The data for our dataset
data: {
labels: [],
datasets: [
{
label: "Temperature",
borderColor: "#ee9090",
data: [],
fill: false,
pointStyle: 'circle',
backgroundColor: "#ee9090",
pointRadius: 5,
pointHoverRadius: 7,
lineTension: 0,
},
]
},
// Configuration options go here
options: {}
});
var chart4 = new Chart(ctx4, {
// The type of chart we want to create
type: 'line',
// The data for our dataset
data: {
labels: [],
datasets: [
{
label: "IR",
borderColor: "#be3c4d",
data: [],
fill: false,
pointStyle: 'circle',
backgroundColor: "#be3c4d",
pointRadius: 5,
pointHoverRadius: 7,
lineTension: 0,
},
{
label: "Vis",
borderColor: "#7484ba",
data: [],
fill: false,
pointStyle: 'circle',
backgroundColor: "#7484ba",
pointRadius: 5,
pointHoverRadius: 7,
lineTension: 0,
},
]
},
// Configuration options go here
options: {}
});
socket.on('temp', function(data) { //As a temp data is received
console.log(data.temp);
var d = data.temp.split(",");
document.getElementById('date').innerHTML = data.date; //update the date
if(chart.data.labels.length != 30) { //If we have less than 15 data points in the graph
chart.data.labels.push(data.time); //Add time in x-asix
chart.data.datasets.forEach((dataset, index) => {
dataset.data.push(d[index]); //Add temp in y-axis
});
chart2.data.labels.push(data.time); //Add time in x-asix
chart2.data.datasets.forEach((dataset, index) => {
dataset.data.push(d[index+4]); //Add temp in y-axis
});
chart4.data.labels.push(data.time); //Add time in x-asix
chart4.data.datasets.forEach((dataset, index) => {
dataset.data.push(d[index+6]); //Add temp in y-axis
});
chart3.data.labels.push(data.time); //Add time in x-asix
chart3.data.datasets.forEach((dataset, index) => {
dataset.data.push(d[index+8]); //Add temp in y-axis
});
}
else { //If there are already 15 data points in the graph.
chart.data.labels.shift(); //Remove first time data
chart.data.labels.push(data.time); //Insert latest time data
chart.data.datasets.forEach((dataset, index) => {
dataset.data.shift(); //Remove first temp data
dataset.data.push(d[index]); //Insert latest temp data
});
chart2.data.labels.shift(); //Remove first time data
chart2.data.labels.push(data.time); //Insert latest time data
chart2.data.datasets.forEach((dataset, index) => {
dataset.data.shift(); //Remove first temp data
dataset.data.push(d[index+5]); //Insert latest temp data
});
chart4.data.labels.shift(); //Remove first time data
chart4.data.labels.push(data.time); //Insert latest time data
chart4.data.datasets.forEach((dataset, index) => {
dataset.data.shift(); //Remove first temp data
dataset.data.push(d[index+7]); //Insert latest temp data
});
chart3.data.labels.shift(); //Remove first time data
chart3.data.labels.push(data.time); //Insert latest time data
chart3.data.datasets.forEach((dataset, index) => {
dataset.data.shift(); //Remove first temp data
dataset.data.push(d[index+9]); //Insert latest temp data
});
}
chart.update(); //Update the graph.
chart2.update(); //Update the graph.
chart3.update(); //Update the graph.
chart4.update(); //Update the graph.
});
function ledSwitch() {
socket.emit('color', "r"); //emit the datd i.e. {date, time, temp} to all the connected clients.
}
</script>
</body>
<style>
h1 {
text-align: center;
font-family: 'Lato', sans-serif;
}
h4 {
text-align: center;
font-family: 'Lato', sans-serif;
}
p {
text-align: center;
font-family: 'Lato', sans-serif;
}
</style>
</html>
This looks like this:
Buoy Data
Buoy Data
Date:
To run my code I need to simply open git bash in the project folder and run node index and then open index.html.
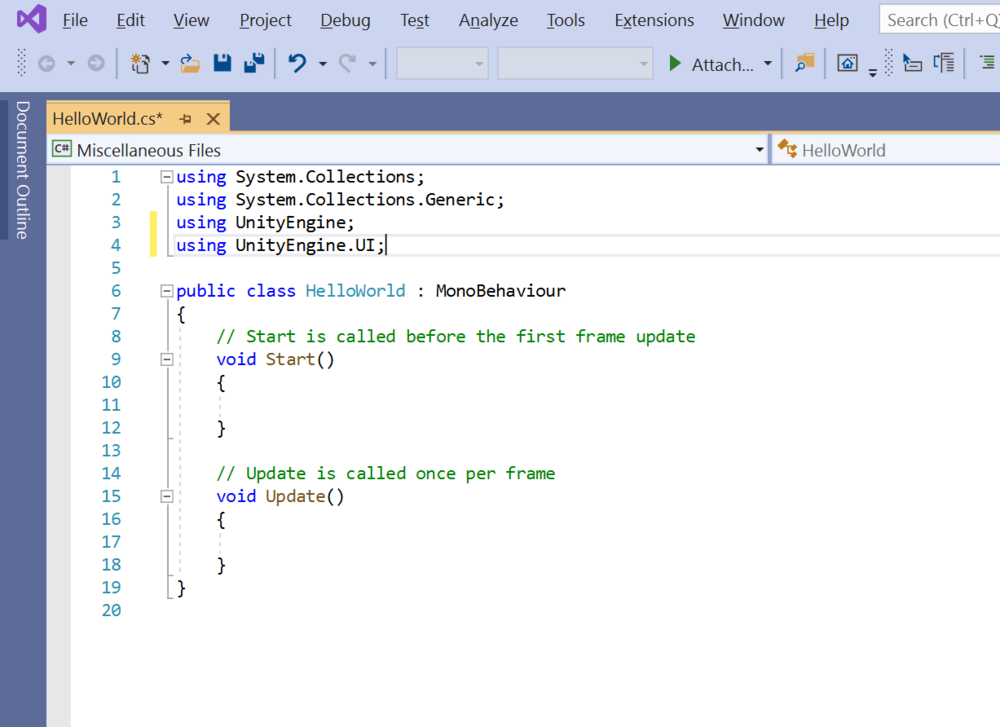
This hellow world then appears in the unity project console! This is what will happen with the serial data.
This is what the overall project looks like, you can create folders for your images, other files, and your script.
Next I made a game object out of a transparent UFO button that I found via google images. I added text to this button with the though that this button could go in my eventual GUI that controls my final project's sensor readings.
This button is contrlled via the serial com script that Diego's tutorial introduced. In his code this script changes the size of a sphere in responce to a sensor's inputs.
After setting up this interface I felt comfortable setting up a serial com port to an interface, but I wanted to explore another avenue. As first I though I would use Unity and I found some exisiting projects to play around with:
Unity was alright, but I realized it was definitiely overkill for creating a data visulation interface for my final project. All of the three.js examples in class were really beautiful, so I set about learned to make an interface with javascript. I found a really helpful tutorial that really helped me set up Node.js and Chart.js. Here is the tutorial Setting up Node.js and Chart.js: 1. Create new folder for project 2. Go to a directory where you want to create this app and create a new folder and navigate to that folder in terminal / command prompt / powershell. now type npm init to create a new Node.js app and fill up all the details.
3. Run “npm install express socket.io serialport --save” to install express, socket.IO and serialport libraries
4. Create index.js files A. I pasted the following code from the example site. This creates an Express server, then connects us to the serial port.
For my interface, I start with an example that appeared like this:
In order to display multiple graphs I need a new class division: