Overview
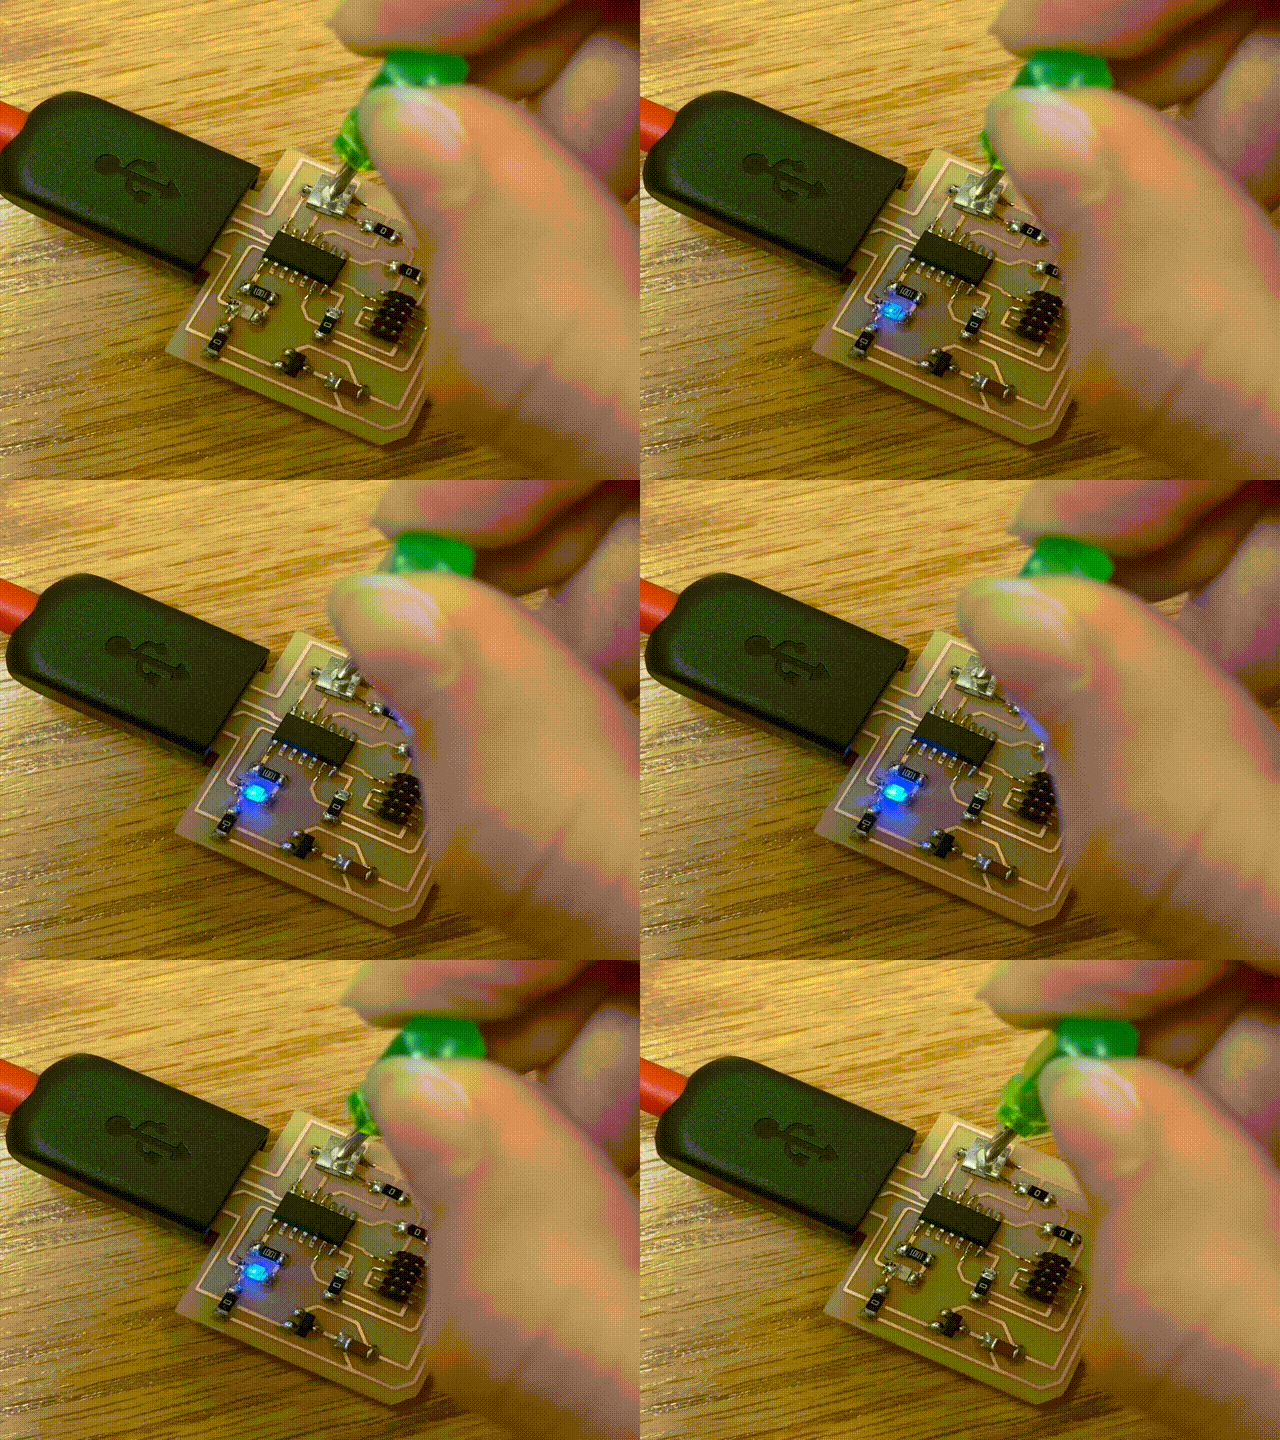
For input devices week, I made a PCB with which the user could control the brightness of an LED by turning a potentiometer. This week, I'll make a
visualizer that illustrates how bright the LED is through a bar graph.
I initially wanted to make a visualizer that illustrated the speed of the DC motor I used in output devices week, but Arduino wasn't recognizing the port. When plugged into my USB-B to USB-C adaptor, the board was powered and I was able to adjust the LED with the potentiometer, so the connection was good, but there was something funky happening with the Arduino IDE. I've had this port problem all semester, with my adaptor/connector only working sometimes, and various other adaptors being more reliable. Anthony said this must have to do with the manufacturing of the USB-B ports, since the cheaper ones work better for being tighter.
After looking through previous years for help, I discovered Maya Murad's project for this week, which linked to J. Travis Russett's project. Both sites were super helpful for figuring out how to do this week's assignment. I wound up following Russett's tutorials to learn the app Processing and adapted his code to work with my board. I chose to look at Processing examples since that app seemed simpler than others and similar to the Arduino IDE.
Code
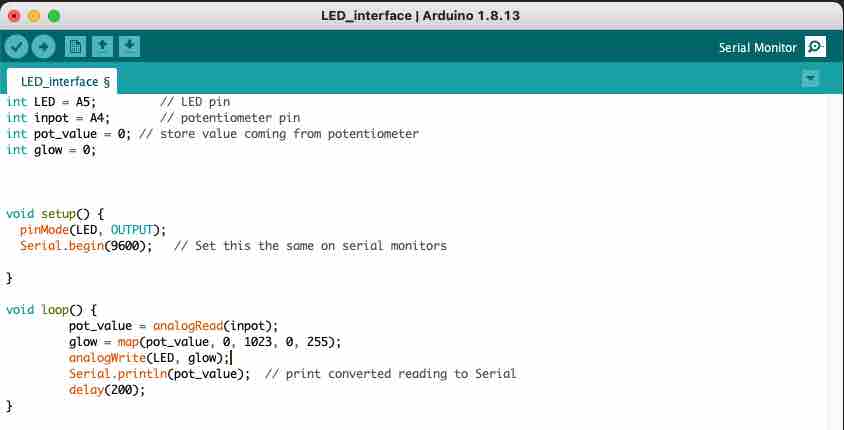
I adapted my code from input week by adding the references to serial. Every value of the potentiometer is displayed in the serial monitor, and the Processing code will grab those values from there.
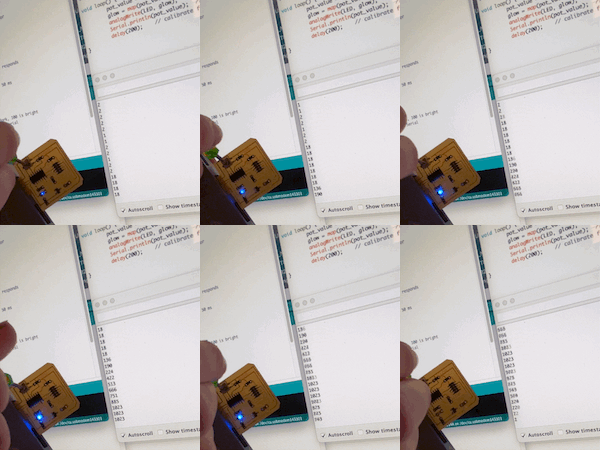
Here's that code in action! The potentiometer values range from 0 to 1023, so turning it all the way to one end corresponds to 0, and the other end to 1023.
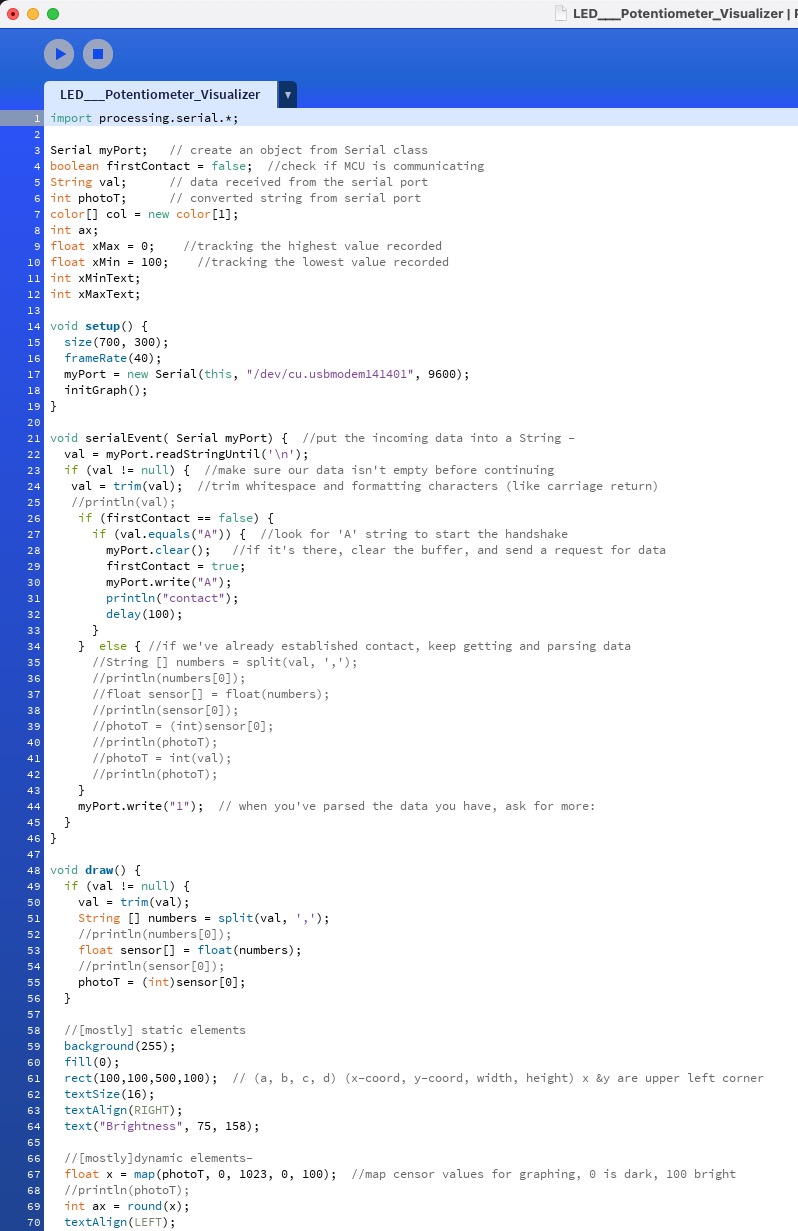
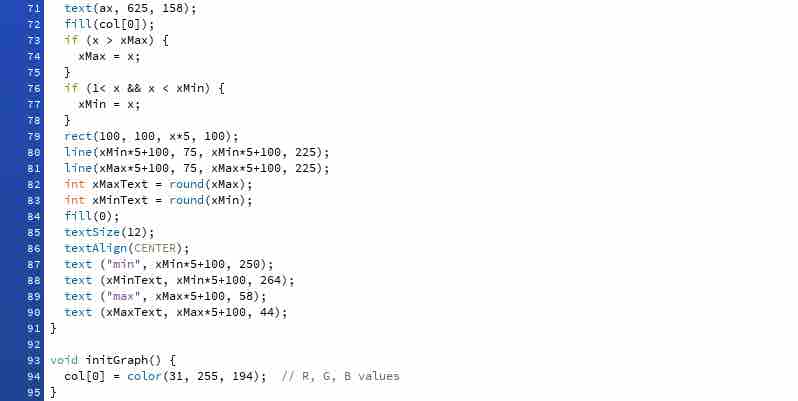
Here's my code from Processing -- really Russett's code with some changes; for example, some small things were that I had to swap the Serial port reference from his to mine, adjust the mapping values, and relabel the bar graph.
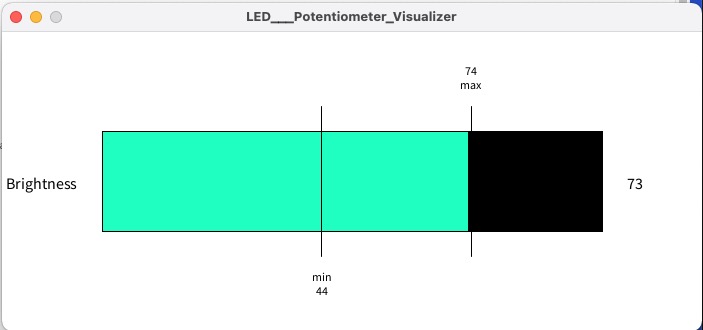
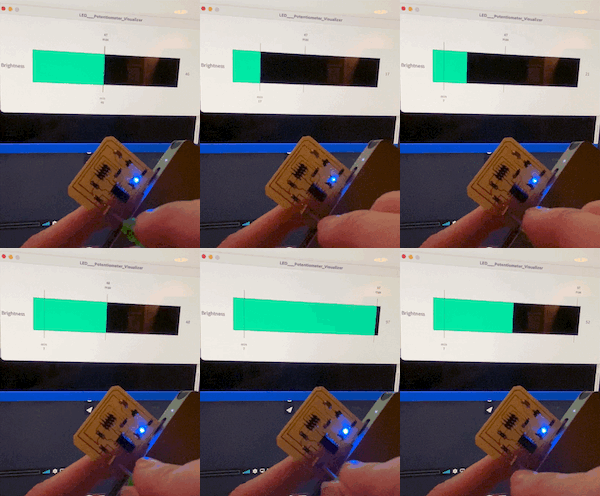
Here's the bar graph visualizer. It records the lowest value as min and highest as max, and the green bar slides as the potentiometer values change to indicate how bright the LED is.
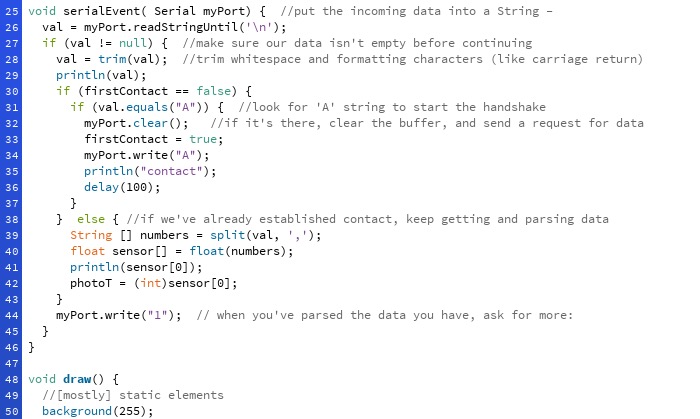
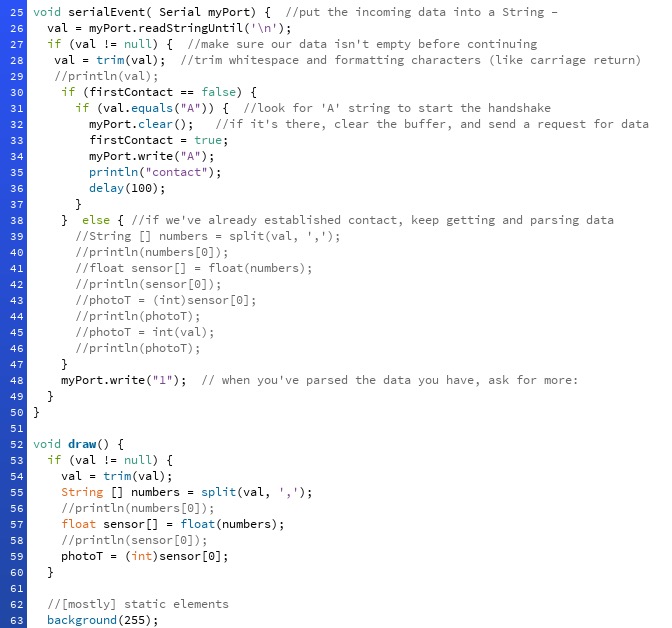
Here's a comparison between Russett's original code (top image) and my changes (bottom). I thought that I would only need a few changes to get the code to work, as that worked for Maya, but I spent a few hours debugging. Although the serial displayed the potentiometer values, the actual graph wasn't moving to indicate brightness level -- just remaining stationary at the brightest value. I inserted many printlns into the code to figure out what was happening and where.
First, I discovered that the variable photoT was always 0. void serialEvent was supposed to grab the potentiometer values from serial, and it was, but it wasn't carrying over to void draw. This shouldn't be the case, as photoT is a global variable. But whatever was happening in serialEvent, draw ignored it.
Many iterations of println-ing in serialEvent confused me, as I couldn't figure out why photoT was being treated like a local variable. I realized I could just paste the crucial code from serialEvent (the code that converted the potentiometer values from strings to integers) into draw. And it worked! I was so, so relieved, but then I closed the visualizer window, a grave mistake.
And when I ran the code again, it suddenly wasn't working! I kept getting a NullPointerException, which meant there were no values being grabbed from serial as strings to convert to ints. I ran through many printlns, baffled since there were, in fact, values being read. Finally, I discovered that the code initially read null right before reading the actual potentiometer values, and so it was halting immediately before registering the rest. This made me realize the significance of (val != null) in serialEvent. I pasted this into draw, and then it finally worked.
