Interface and Application Programming
Build user interface and visualize data
01 Group Assignment
//
Compare different tool options for user interface
We compared different methods of inteface programming and here is what we observed:
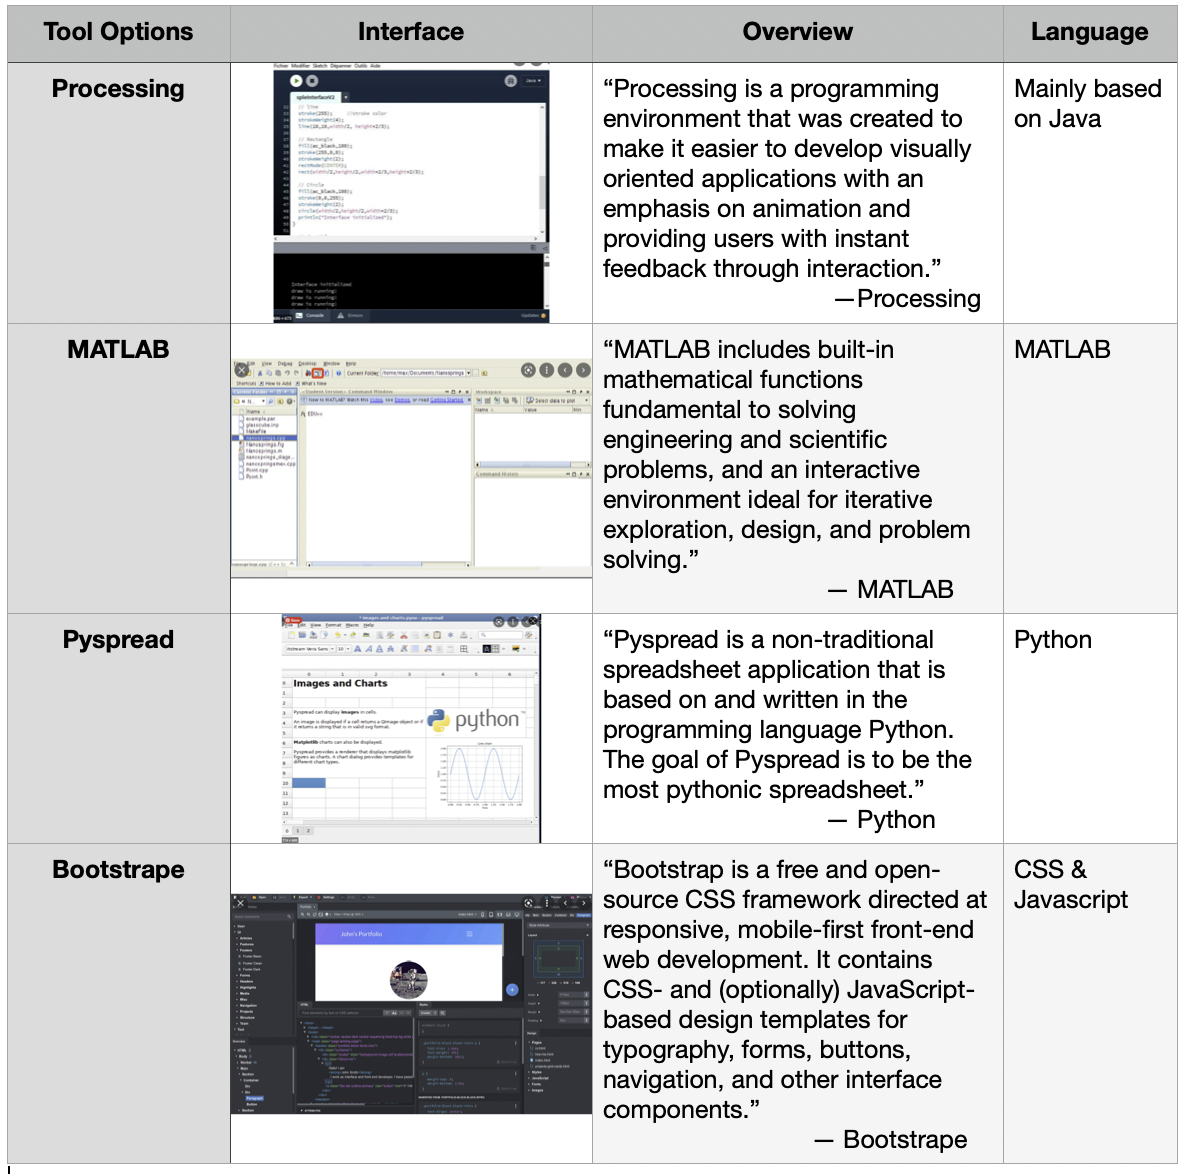
Here are four very distinct interface tool options. Processing is a strong visual programming envrioment. MATLAB and Pyspread are more math and engineering related. The output interfaces tend to be charts and diagrams. Bootstrap is a strong user-friendly web page edit application. There are a lot of great templates provided by bootstrap and they also have their own application to do the backend programming.
02 Individual Assignment
//
Write an application that interfaces a user with an input/output
For this week, I decided to design a user interface that shows an array of pixel data of an image uploaded (INPUT) by the user. I started this task by using processing.
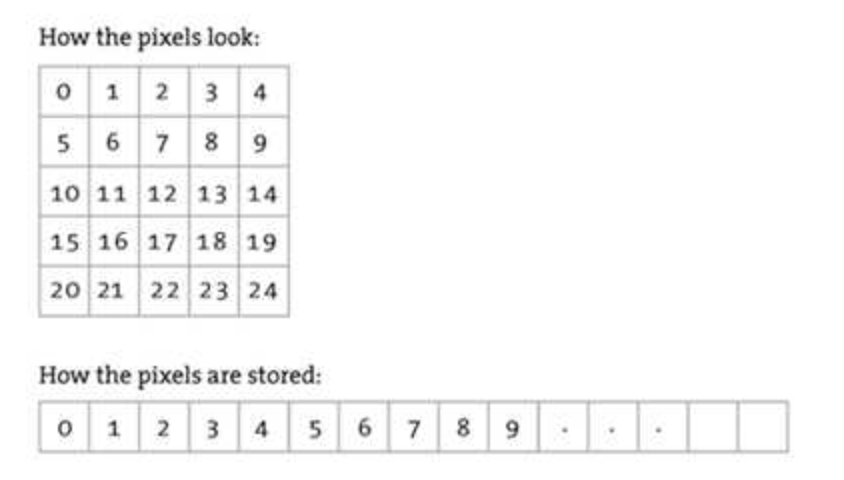
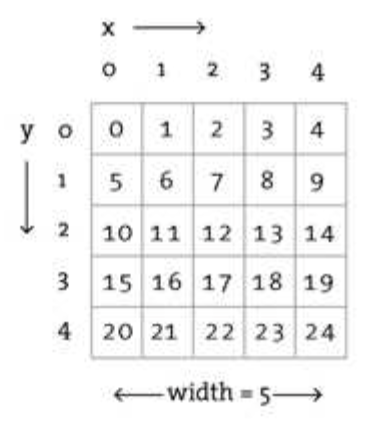
Processing has really nice documentations and online tutorials to follow. I read through the official documentation and tried to understand how processing access pixel informations. By default, processing access information one by one, from left to right, but it can also access color data by specifying a sepcifc 2D location given x,y cooridnates. In my matrix case, I simply just use the default mapping so that the informations can be pass down without using a position cooridnate.
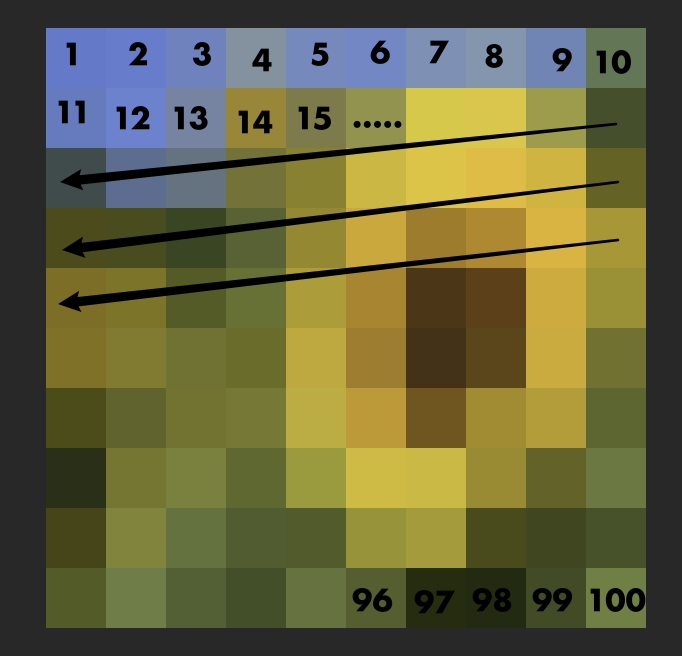
To better illustrate the mapping, you can see the image above of how each pixel is recognized. I wired the LEDs following this pattern to reduce the amount of code I needed to write.
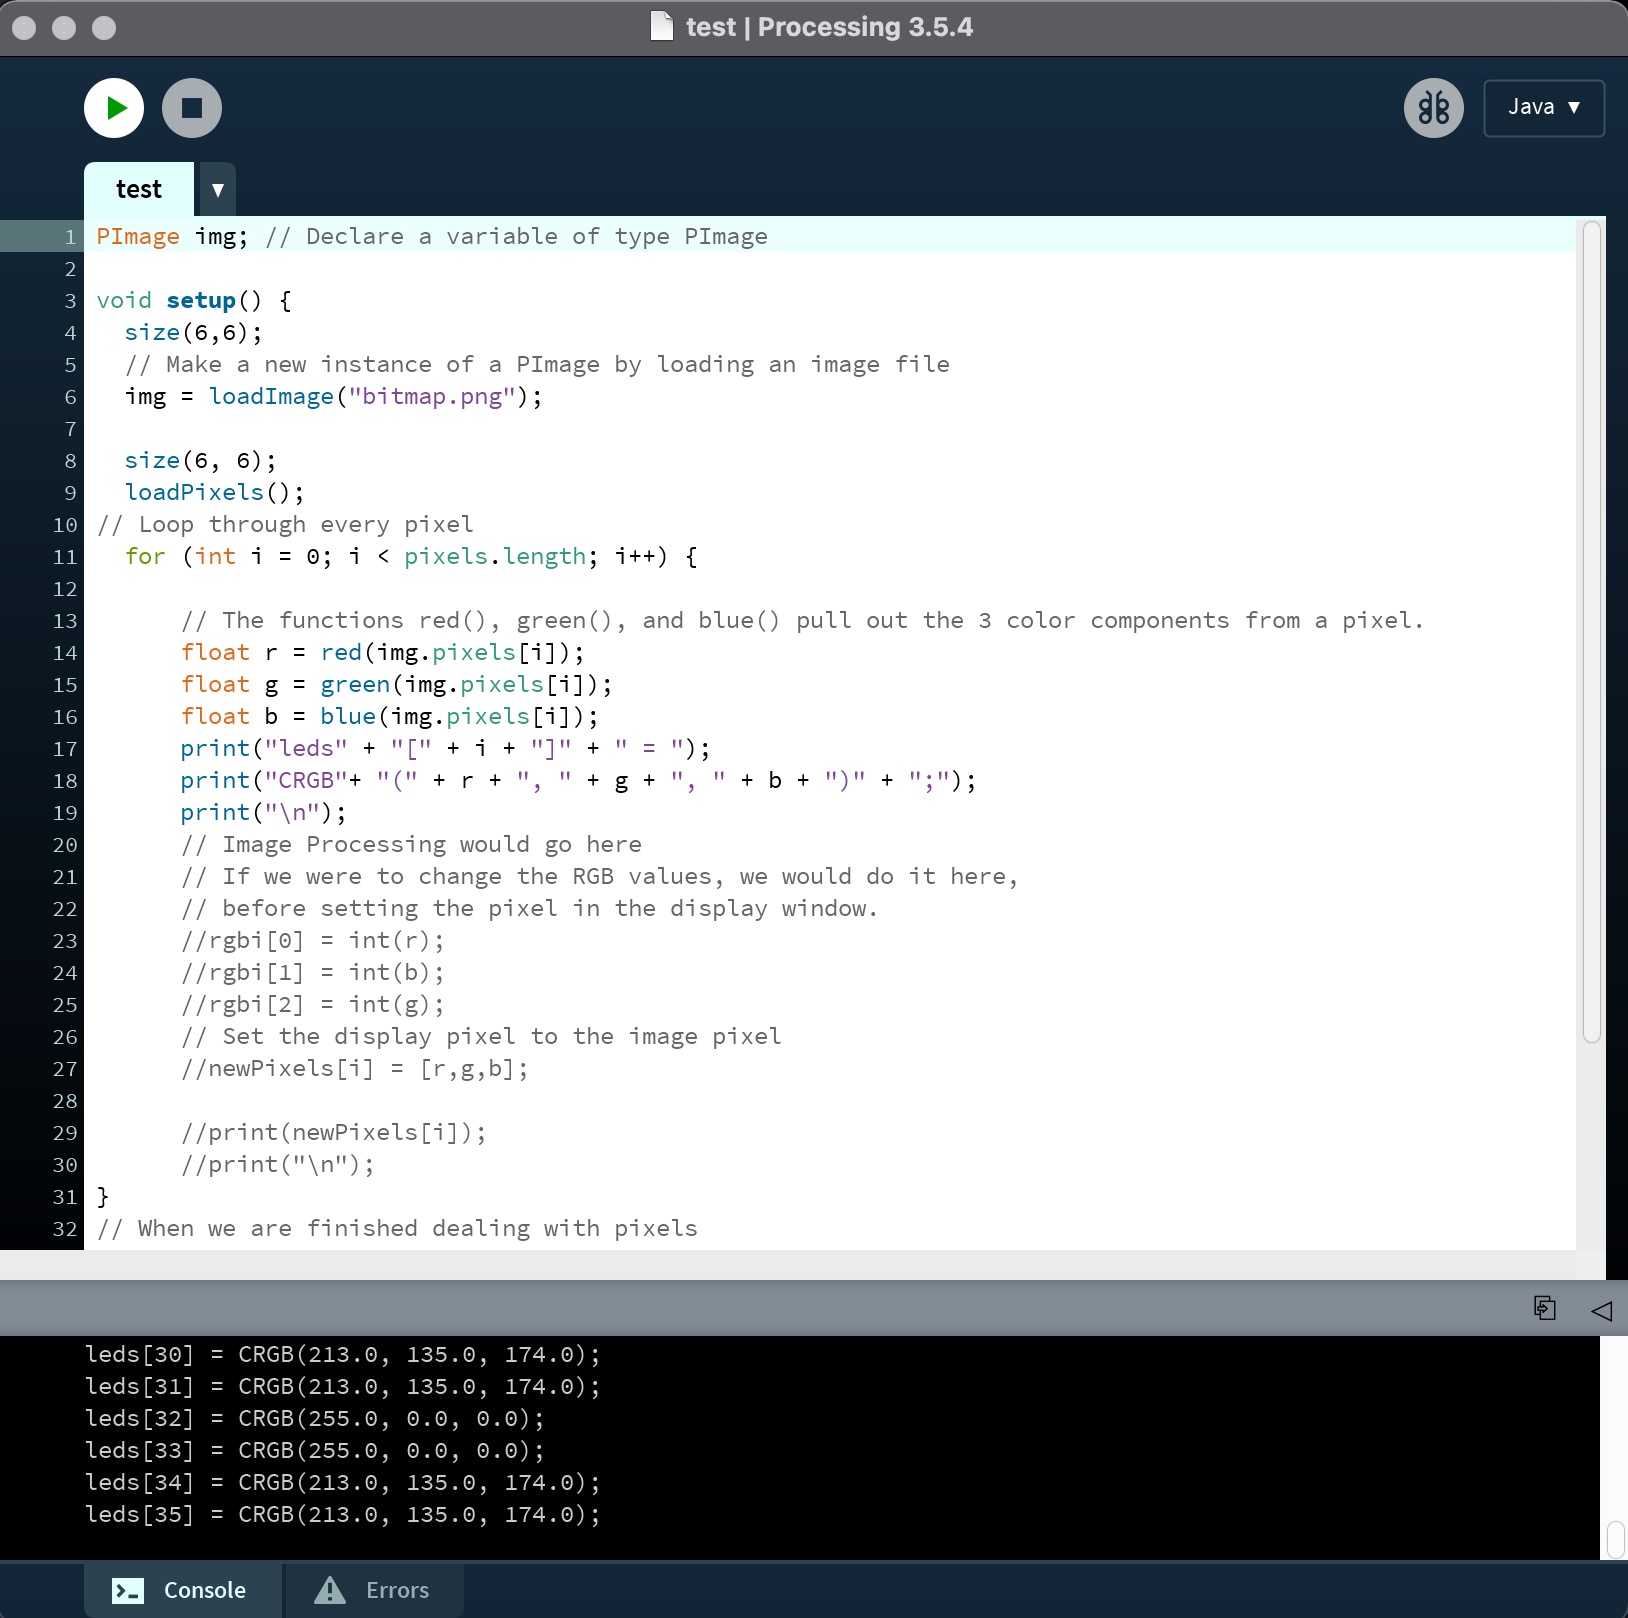
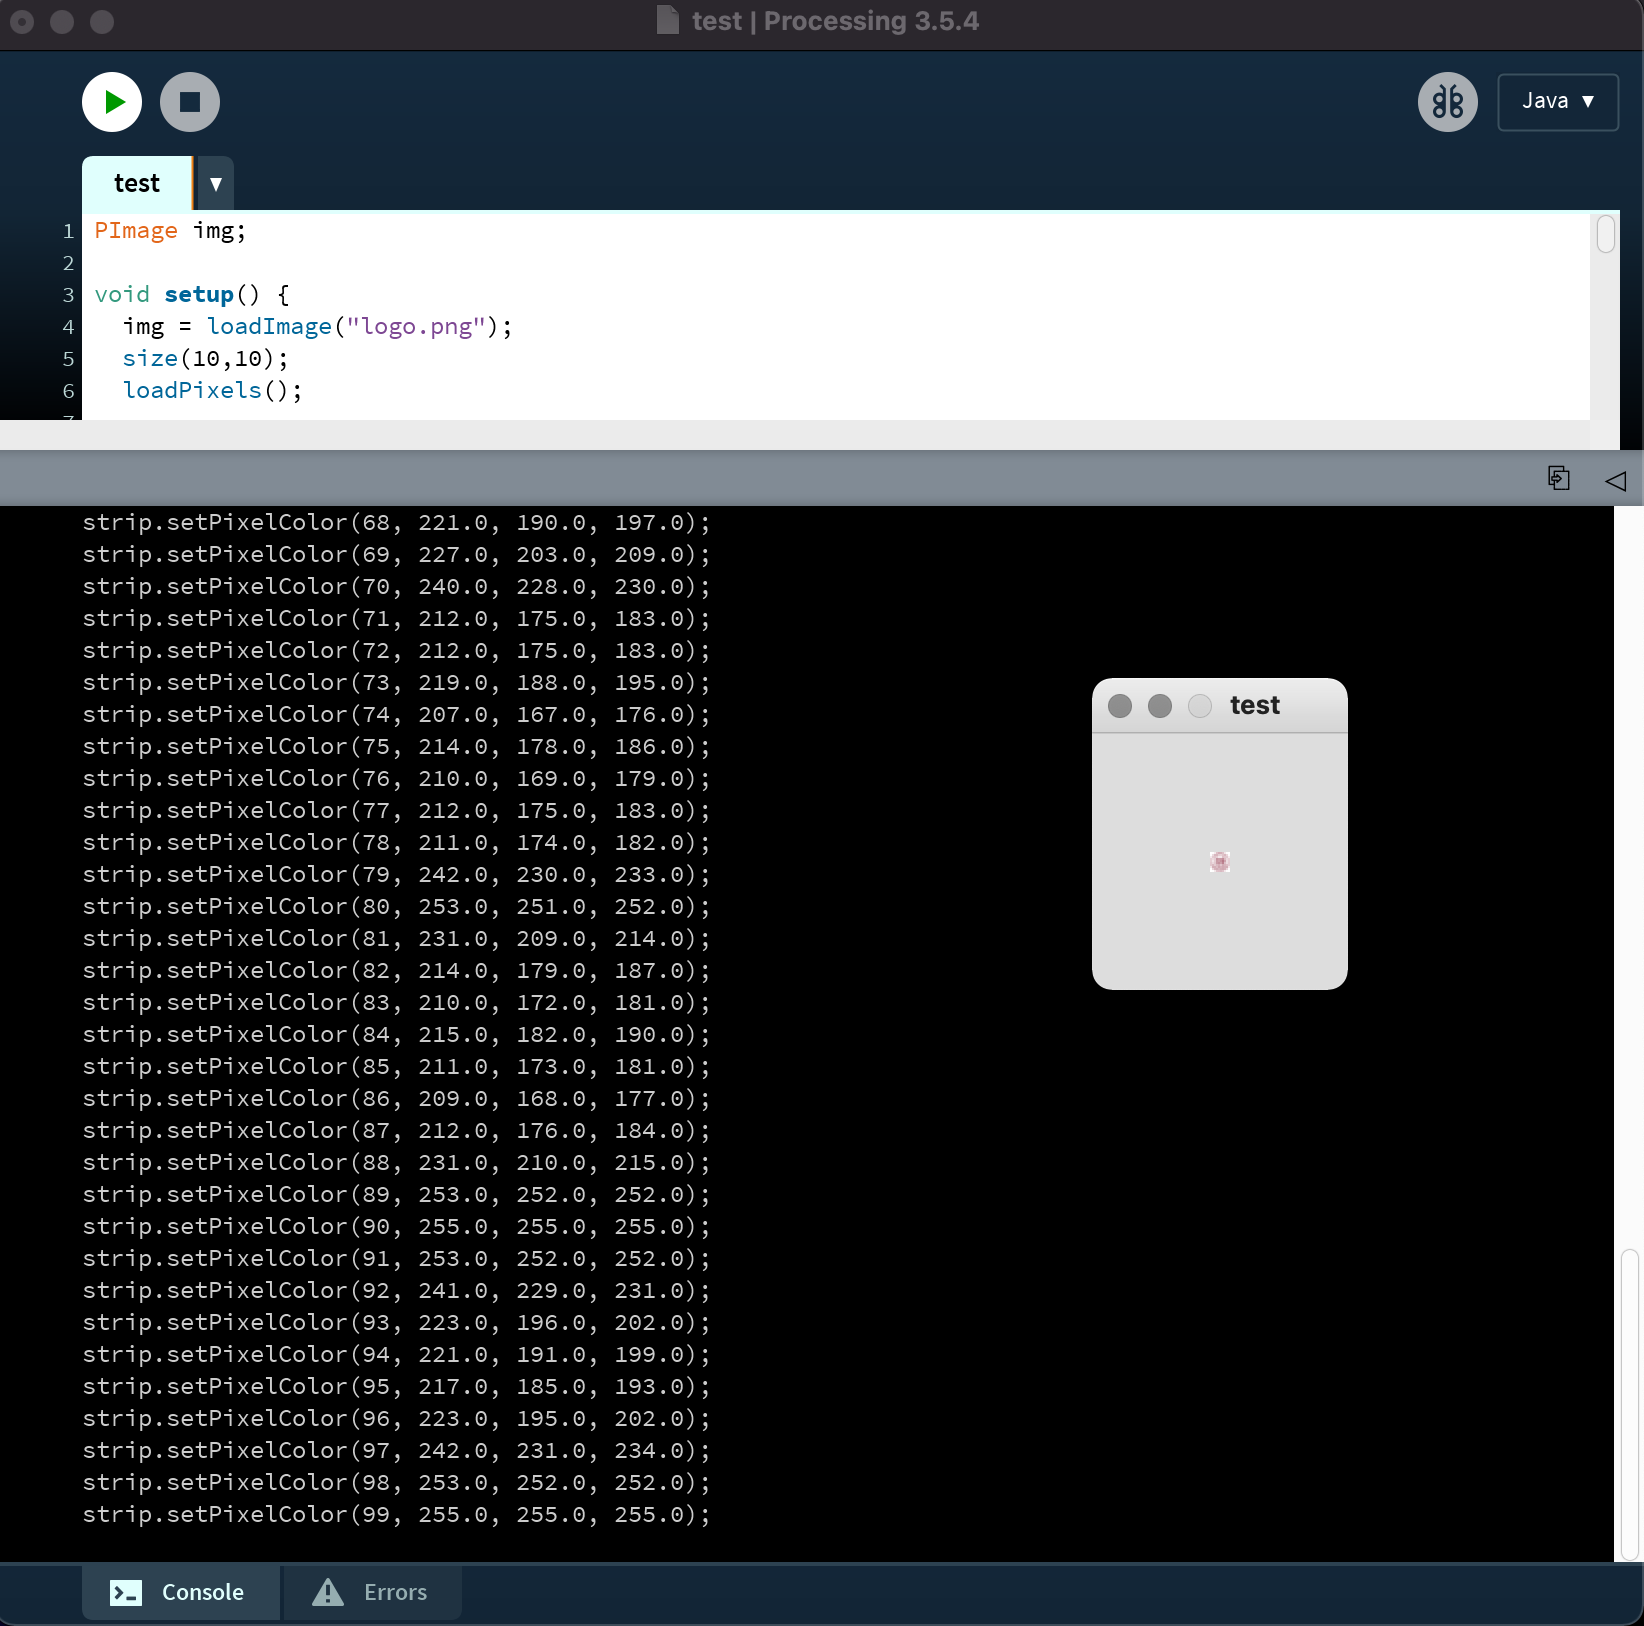
Processing has a very nice console that can print any data passing through the code. I used the command "println" to display the color values. I used the code from Processing's official tutorial website and made some changes. Now it can recognize any 6 by 6 or 10 by 10 pixel images, and can return a array of data than can be directly uploaded to Arduino for display.
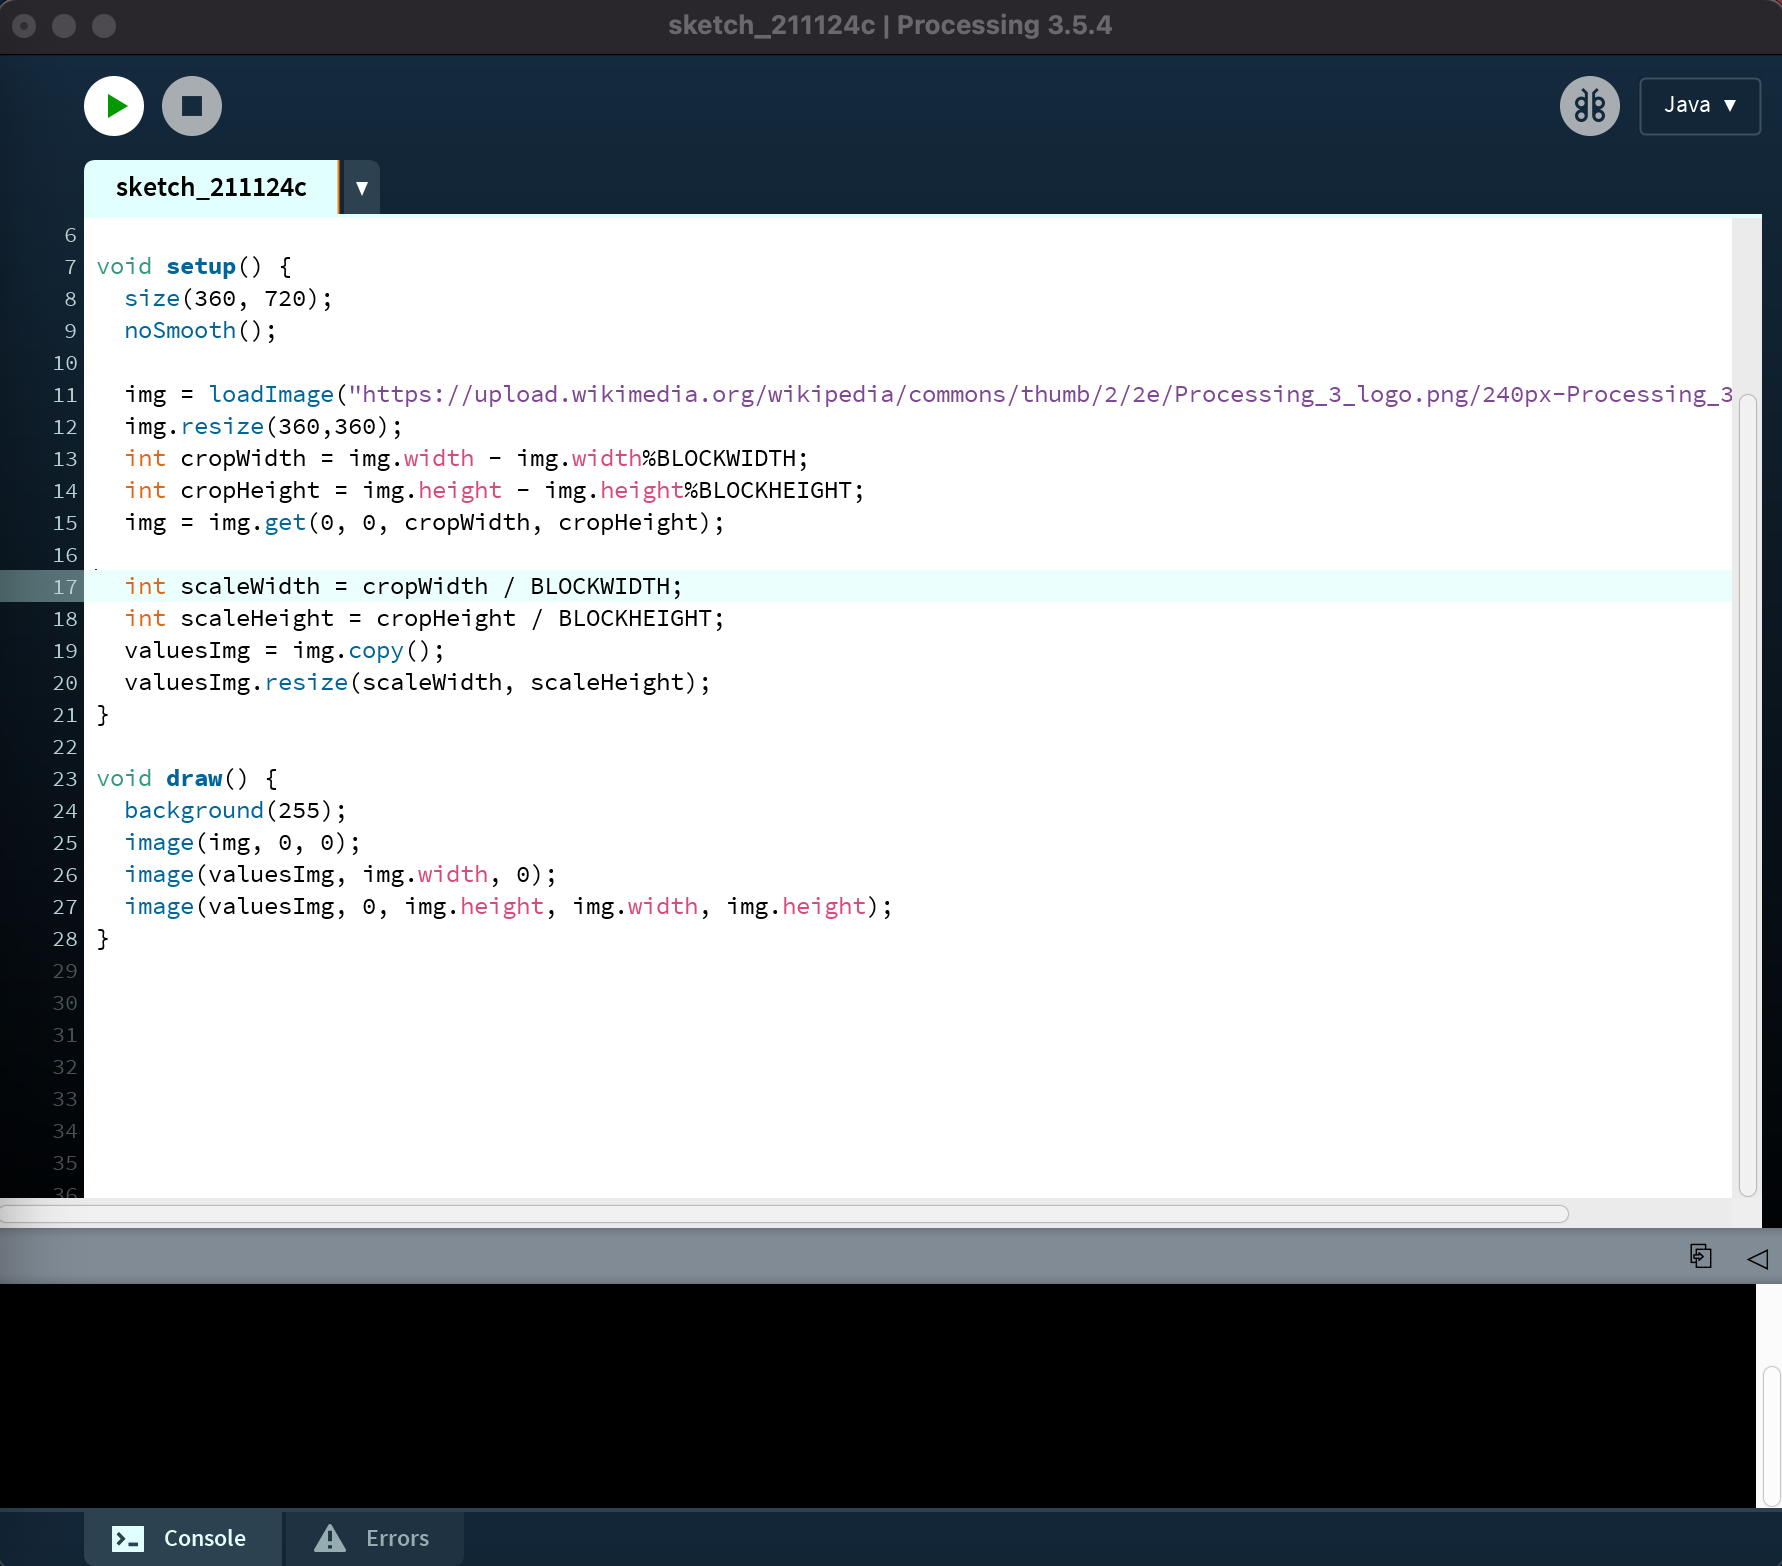
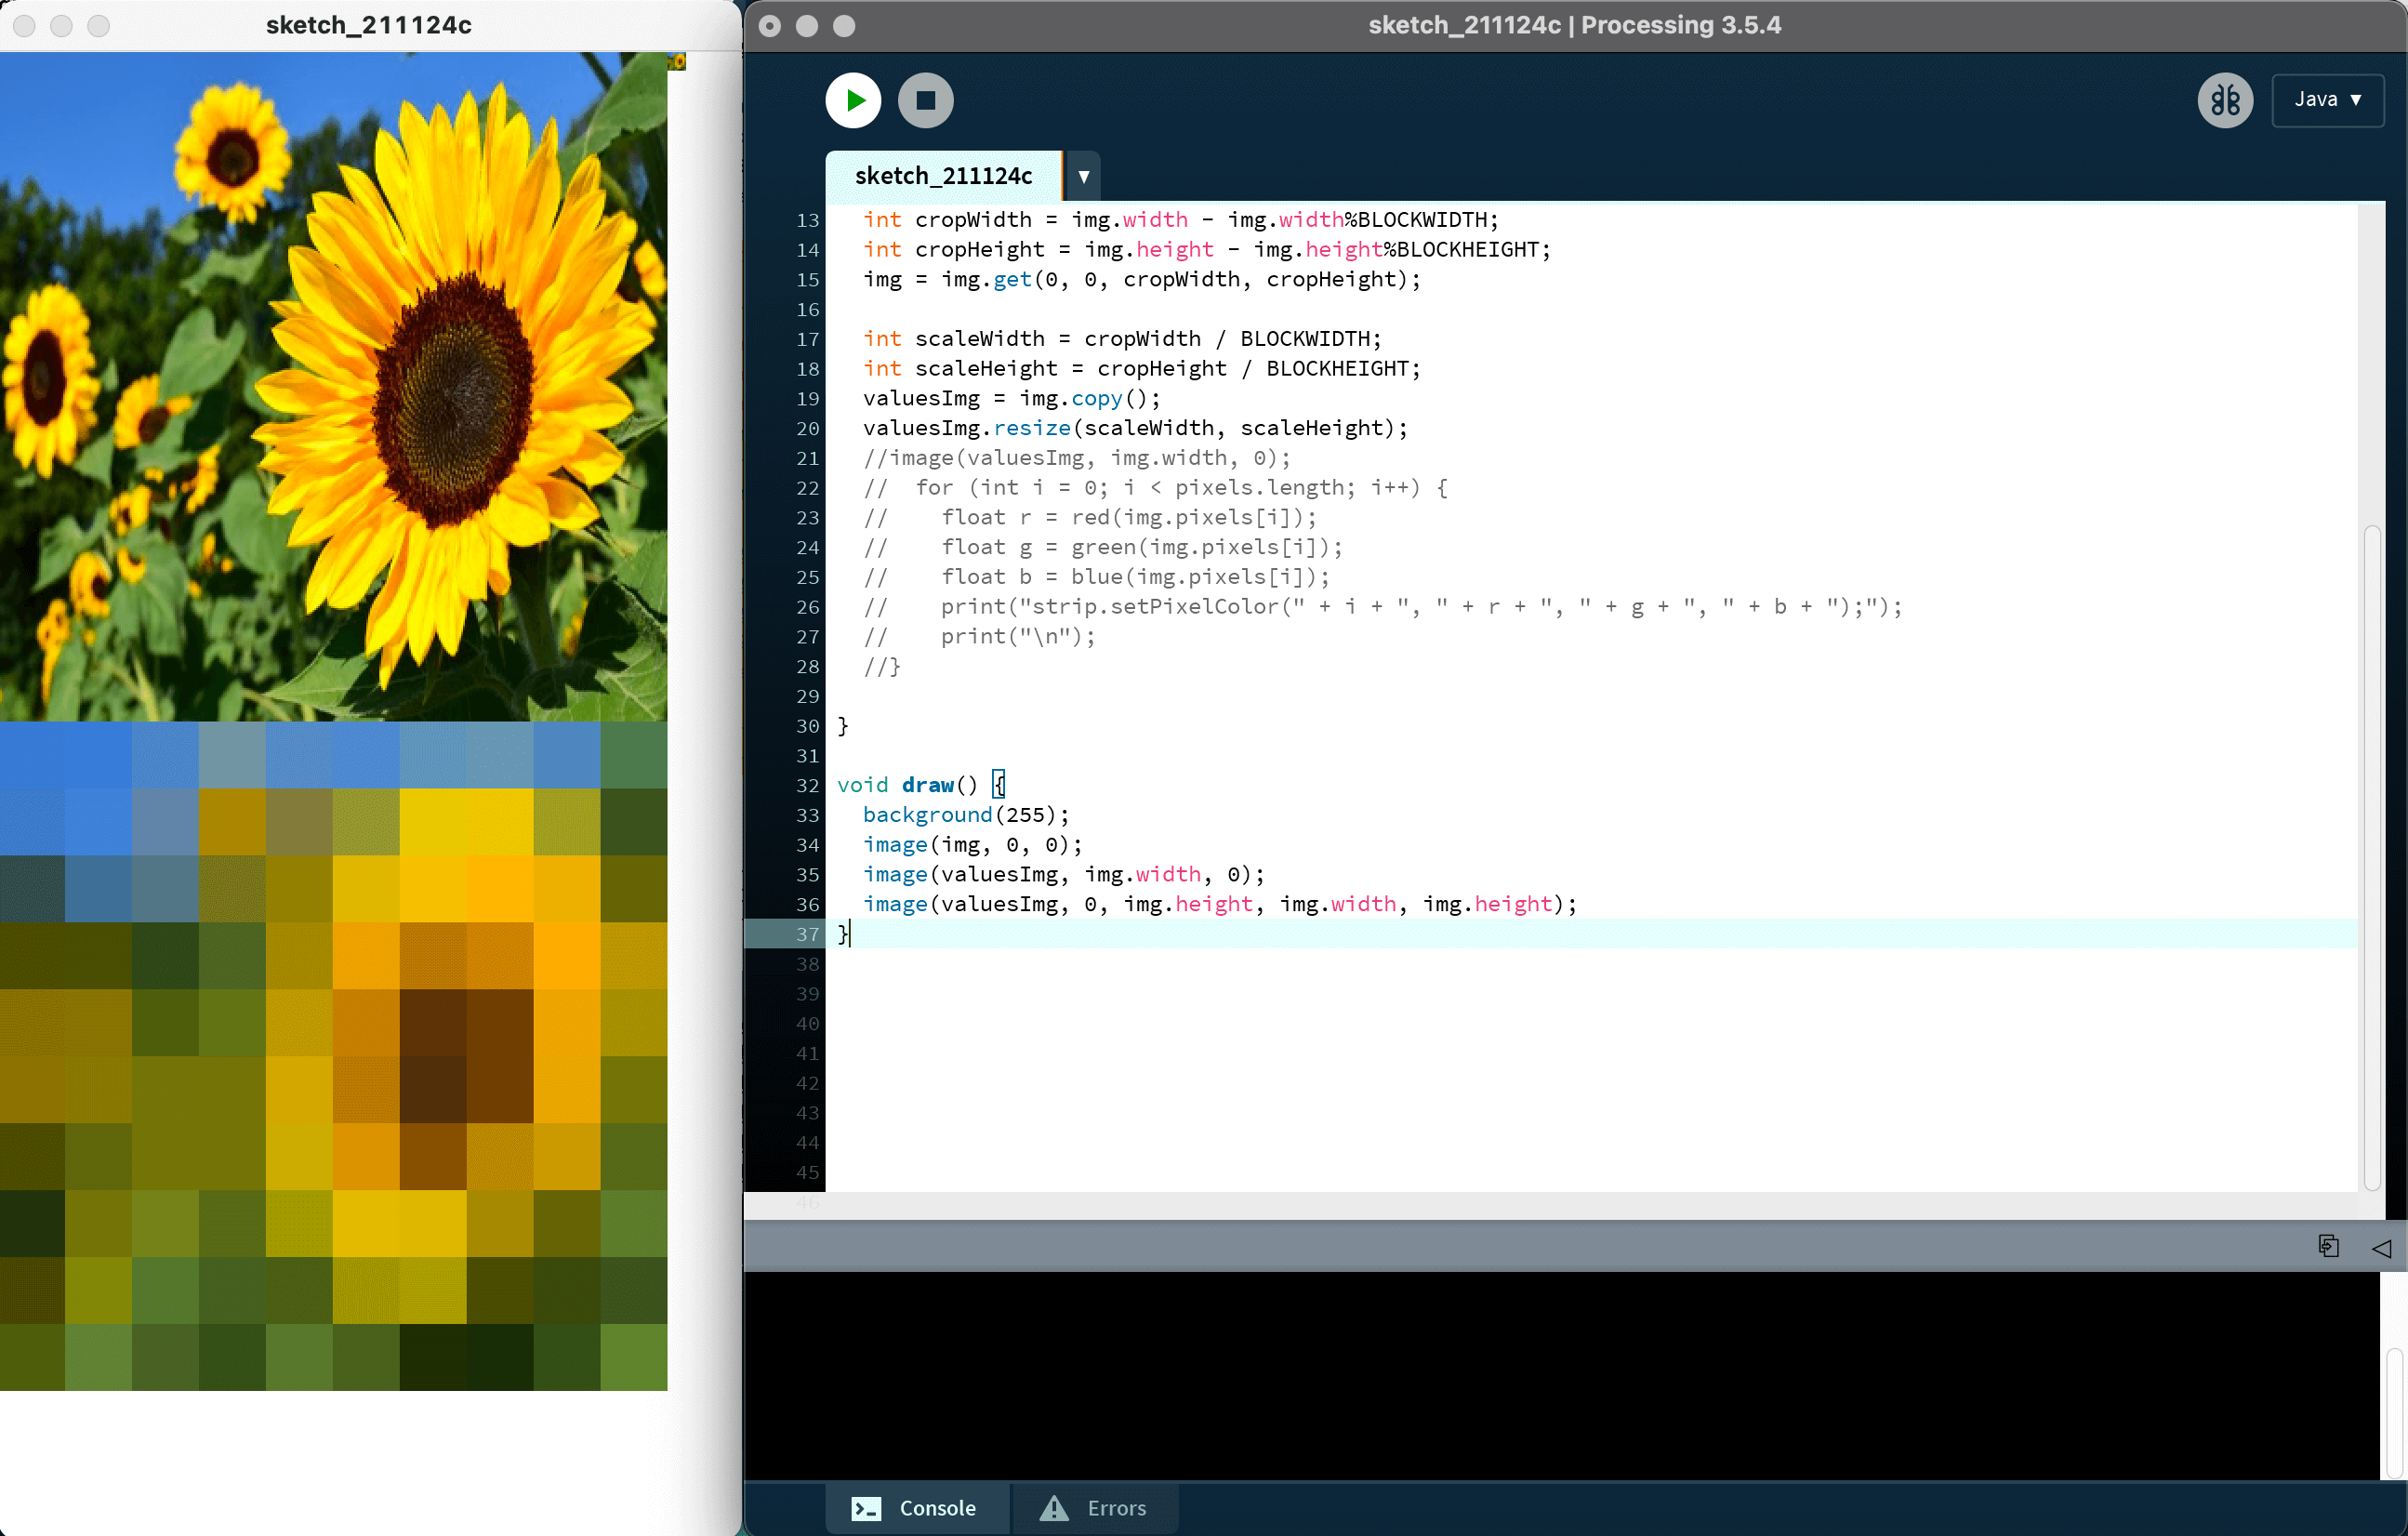
Now that I have the program to recognize the pixel informations, I need a program to pixelate any image that user uploads by choice. I found some code from prcossing forum that can pixelate images and resize it to whatever size you want. I made some edit to the code so that it can output a image that is 10 by 10 pixels. You can see from above image! The sunflower images that is originall 360by400 is compressed and made into a 10by10 pixel image. Now I can upload this program into my last proccessing program to get all the pixel datas.
Processing reference for pixelate image can be found here!
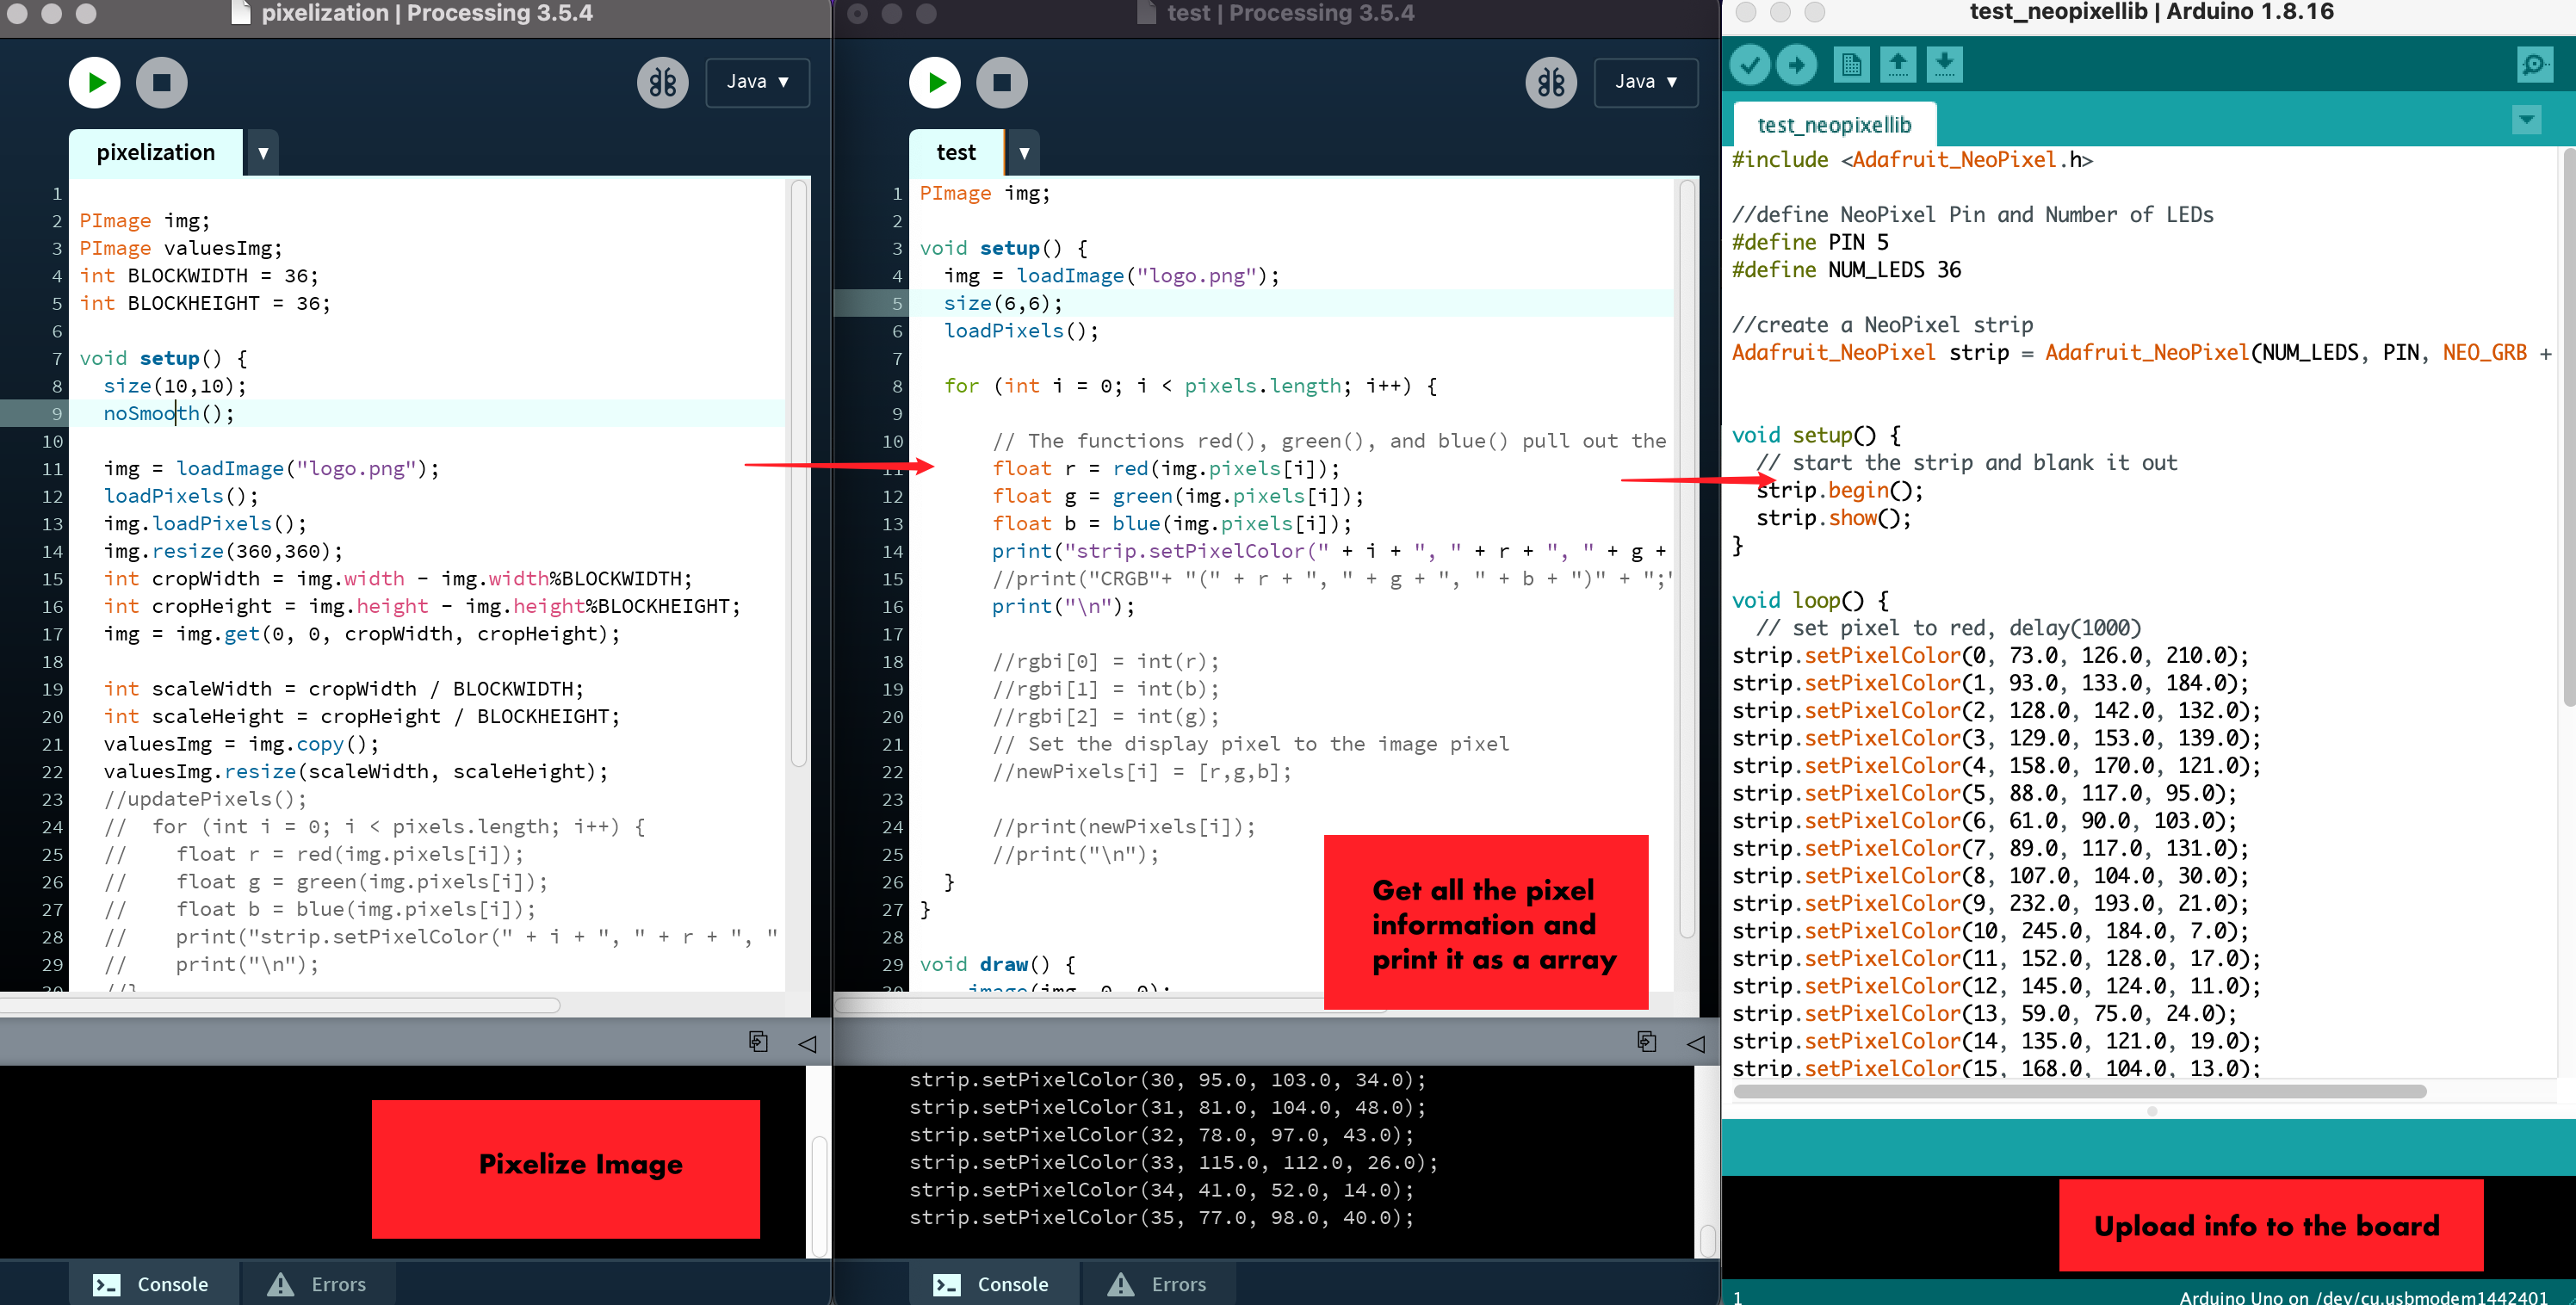
My inferface workflow is not quite user-friendly for now, because the process required the user to use processing twice to get the pixel information, and switch to arduino to upload the data. I will try to simplify this process when I have time. However, it does work for now and delivers a array of data needed for the hardware part.
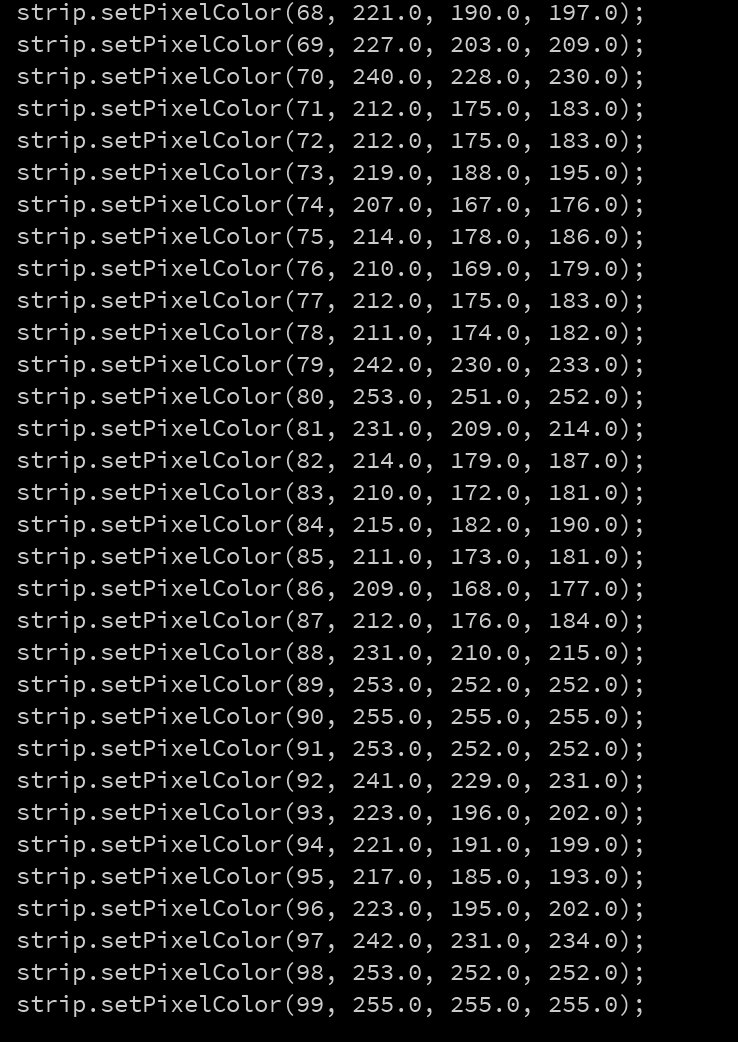
This is the output of the interface! I edited the print message so that user can directly copy this information to arduino.
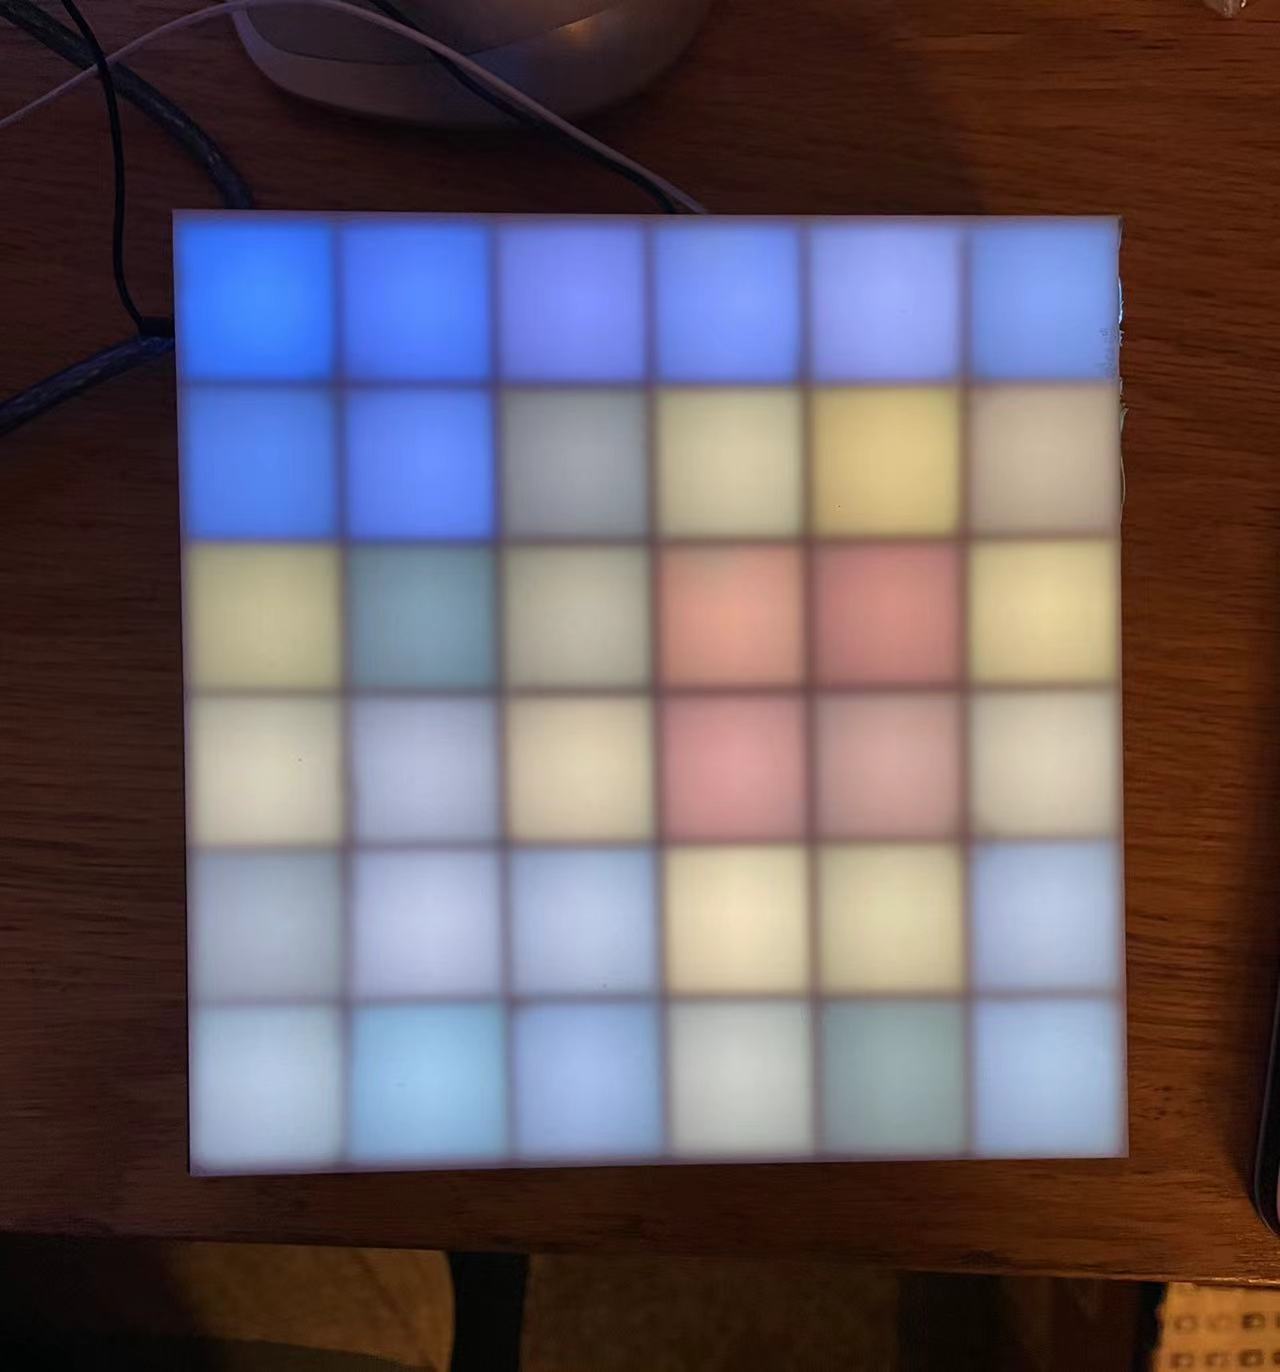
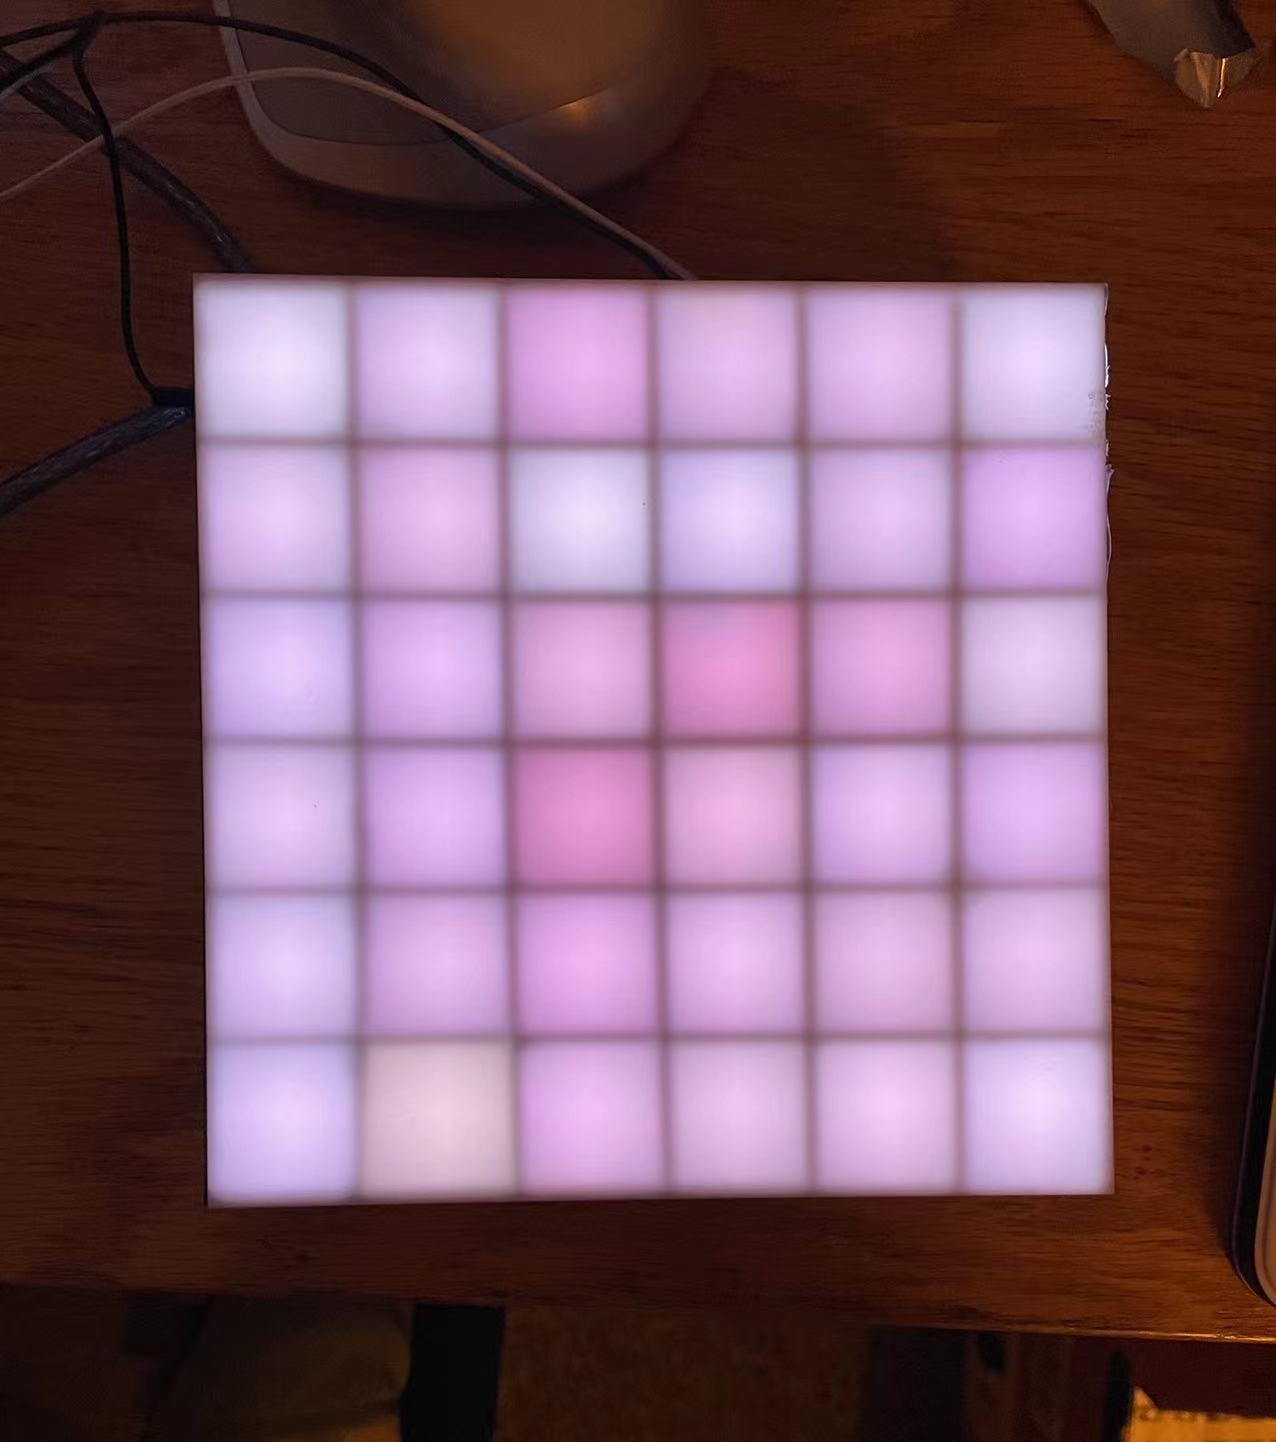
I tested the color information on my 6by6 prototype and it works perfectly (The one on the right was suppose to demonstrate the MIT logo, but there were too much details for this 6 by 6 canvas to capture)! I can't wait to display onto the 10by10 grid which will preserve more details of the original image.
//
Interface with MATLAB
I also tried to program the interface with matlab. Matlab's command impixelinfo returns a interactive data series where the user can move over their cursor and see the RGB data for each pixel.

You can see from above gif that when I move around the cursor, the RGB color data on the right buttom corner will change according to different pixels. In this way, user can easily access a individual pixel data and make changes.

Here is a zoomed up version, the array does live updates according to the position of the cursor.
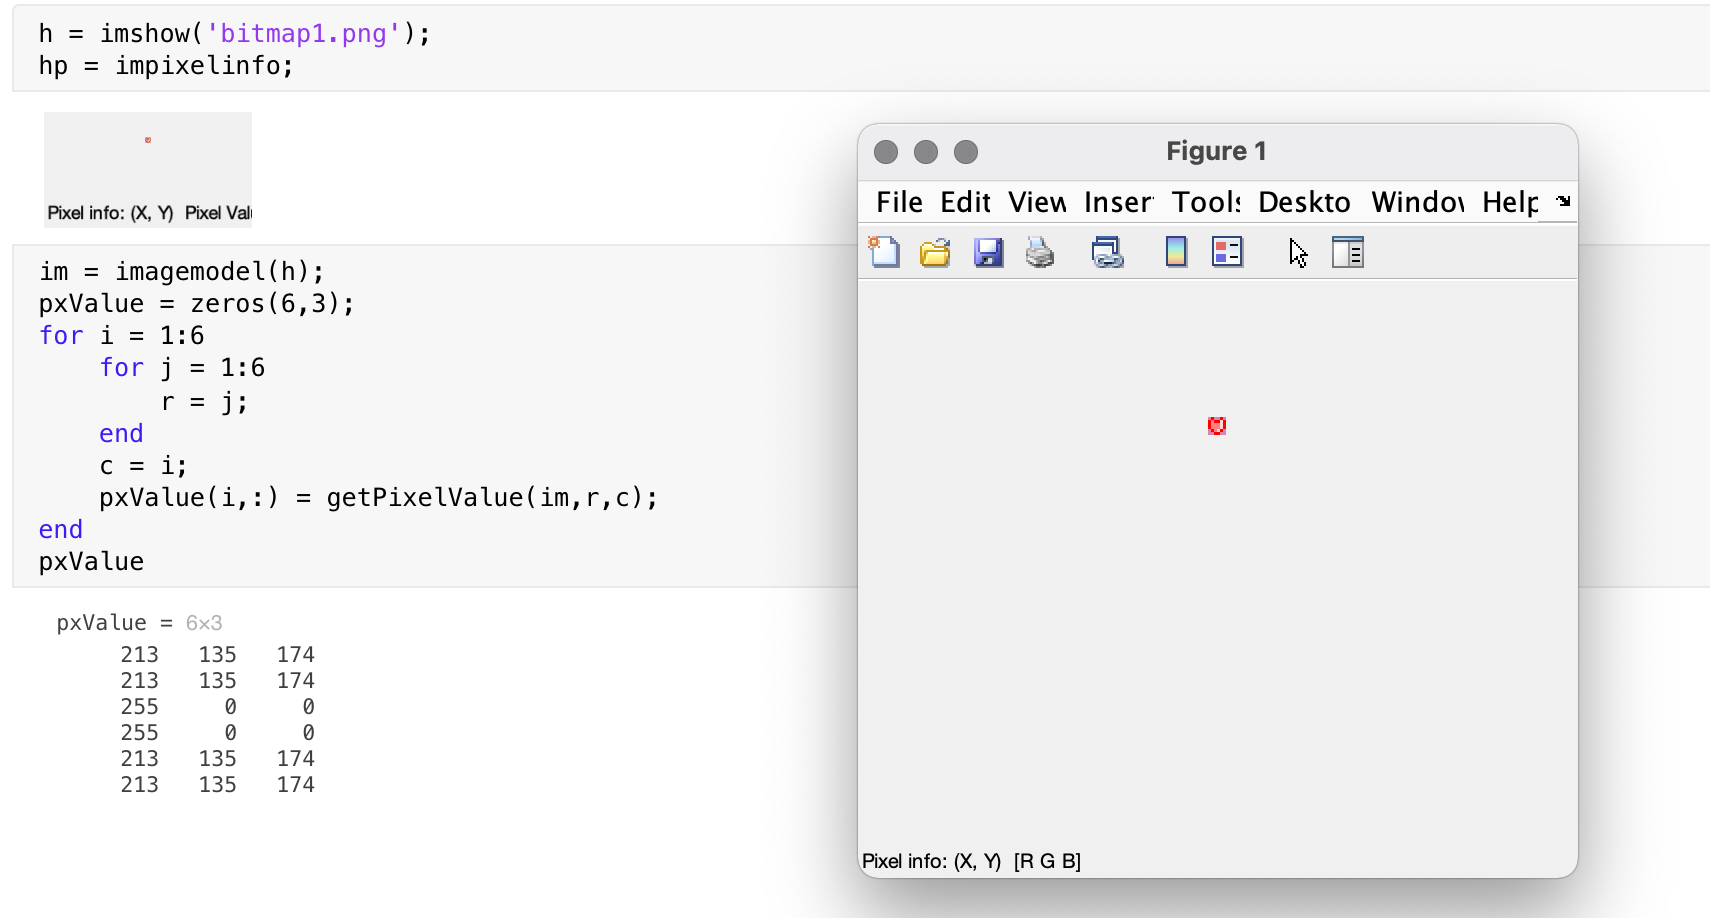
This is a simple code I wrote in matlab. I have some background in Matlab so it wasn't very hard to use a for loop and print out all the RGB values of the pixels. This interface essentially does the samething as processing, but with a shorter amount of code. I am really glad that MATLAB has a command called "impixelinfo"!
03 Conclusion of the Week
//
Gained skills
Intro level to interface and software programming
Thoughts and lessons learned
I actually started the software part 3 weeks ago just to get familier with the back side of things. So accumulatively I have spent quite a large amount of time in the software part. It was very satisfying to figure out things step by step and seeing things come to life!
Here are some of the lessons learned that I think would be beneficial to know before starting this week:
1. Include a reasonable amount of software part to your project if you are not very familier with backend programming. Try to achieve the basic functions first and then try to add on fancy features.
2. Processing is good starting point! It functions similar to arduino.