Week 11: INTERFACE + APP PROGRAMMING
A. IDEA + PRECEDENTS
A1. Visualization Idea
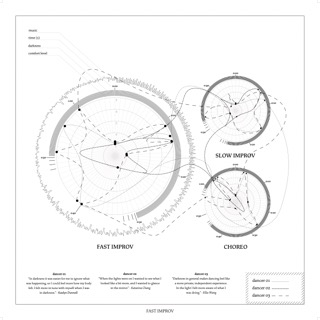
1.1 So my original plan was to create a program that would map the input from a sensor on the same sort of maps that I created last year (further description on my final project page). I basically want to graph the sensor data over time radially rather than linearly, in order to generate my previous drawings a lot faster and more accurately.
A2. Coding Precedents
2.1 After meeting with my TA Reina she suggested that I look into processing in order to make data visualizations.
2.2 I found only one precedent of radial mapping for arduino and it was mapping a distance sensor to a radar map. My original plan was to adopt this code to my final project sensors, and then edit it to look like my original maps. However, I ran out of time and this code was overwhelming to understand... so I decided to simplify my goal to just having a linear map of my sensor values.
2.3 For the linear mapping I followed this precedent and altered the serial port, visuals, and added a save function.
A3. Timeline...
3.1 So to be completely honest I didn't do this weeks assignment until the final project week. I am not a coder and any coding assignment takes me an absurd amount of time and a lot of stress, so naturally I left it till the last possible minute to complete this assignment....In the future I do want to explore visual and creative coding more. I know it is a necessary skill to be able to represent the data I collect from dancers in the artistic way I would like. But due to short timeline and my overall apprehension about my ability to code I was not able to completely replicate my original drawings through code for the final project, it is hopefully something that will come soon after!
B. WRITING MY CODE / EDITING THE PRECEDENT
B1. Arduino Code
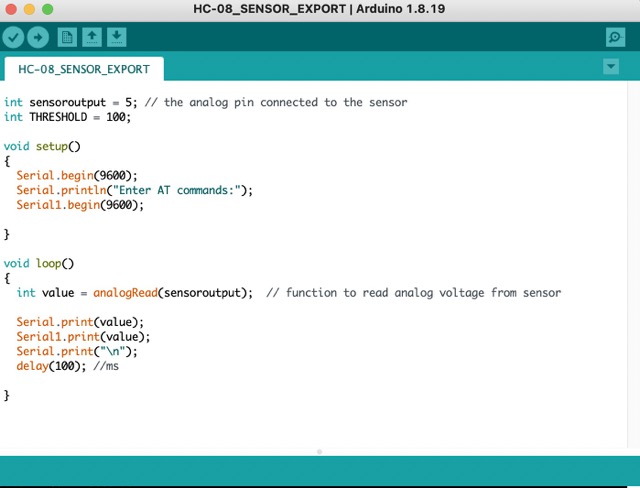
1.1 For the arduino code I mainly just had to change my port name to match the usb port I was using.
1.2 I have both "Serial" and "Serial1" because for my final project I was trying to get the sensor to communicate with my computer via bluetooth and the SAMD11C14 uses Serial1 to communicate with a bluetooth module.

B2. Processing Code
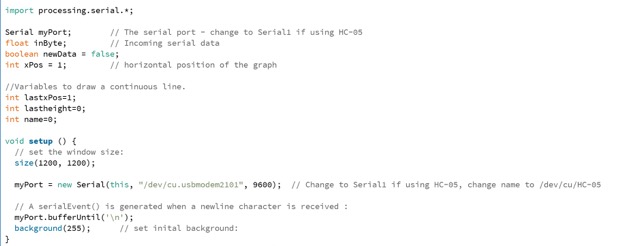
2.1 This is my final code in processing, I changed the "myPort" line in "void setup" to match my usb port name coming in from Arduino. I then added a save function in the "void draw" section so that I could save a .tiff image of my graphs to my desktop.
C. TESTING MY CODE


C1. Once I got my sensor connected and saw that arduino was getting values in the serial monitor I hit play on my processing script and it started graphing my sensor values!!! Woohoo this was SO excited and I was very proud that I had gotten a code working :)