Interface and Application Programming

This week we need to design an application to interface a user to an input or output device we made previously. This is about as far from my comfort zone as we can get, so I decided to scope the assignment for something rather simple and straightforward. Neil linked a 2021 Fab Academy page as the example assignment for this week, and one of the projects there could be easily adapted for my situation. Let's dive in.
My goal is to visually represent the incoming serial data from my theremin to a basic software interface. On Nadieh's 2021 Fab Academy page, she shows that serial data can be graphically displayed in a retro stereo-mixer program using node.js and D3. Below are examples of her work from a phototransistor.
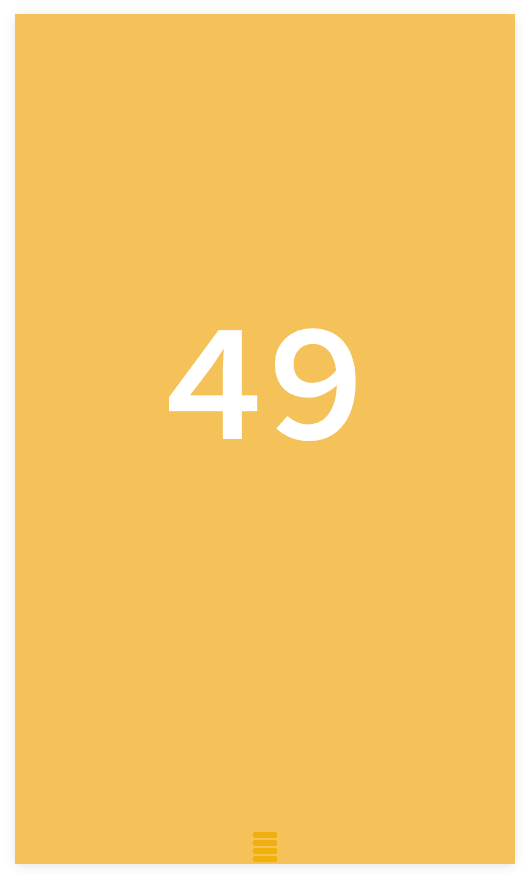
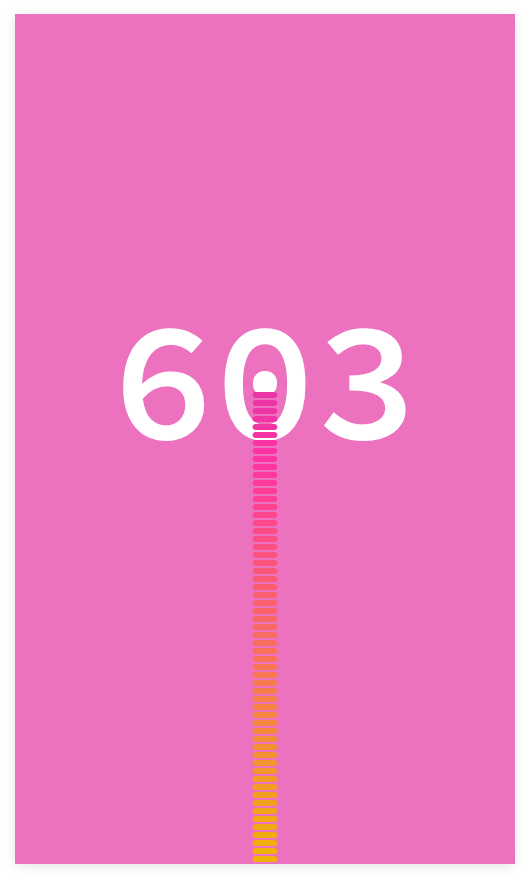
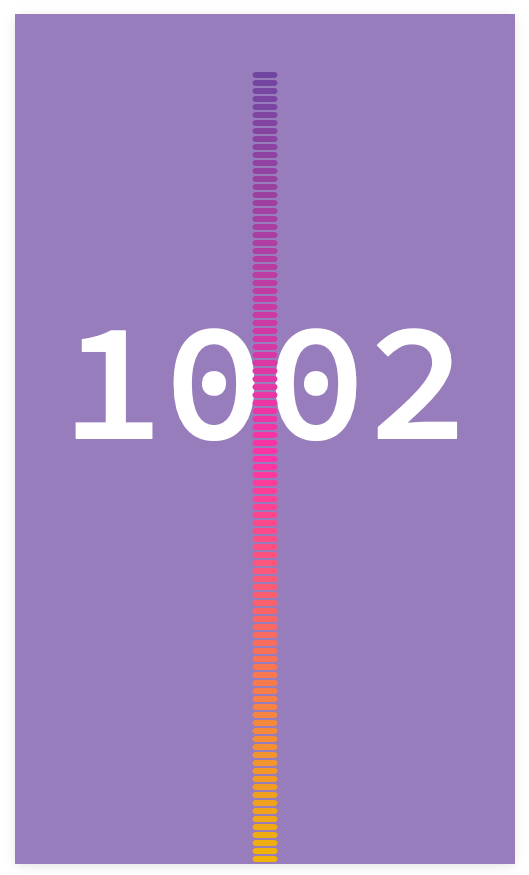
Since my theremin is making sounds, this seems like a nice example to follow along and have a simple interface for the device. The SAMD21 in my theremin prints serial data in the loop that is measured from the native QTouch inputs. Connecting this serial data to my app and graphically displaying it will be the main objectives for this work. My final project wont require this interface, so this week's assignment is an isolated case. The main hurdle is going to be JavaScript. I have no experience with JS and I have no experience with any of the tools associated with it. This is a steep learning curve for me.
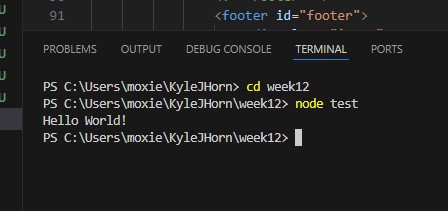
While I suppose it's rather trivial, a lot of effort went into the below figure. Just getting a JS 'Hello World' is a victory for me. I downloaded Node, a JavaScript environment, and called that in both cmd and my VSCode workspace to test it out (this sentence holds about a day's worth of troubleshooting and feeling like a disappointment to my bloodline). But here is my small victory!
From there it was a matter of following along with the example on Nadieh's page (along with a lot of googling). Her example notes that D3 also has a very steep learning curve, so my spiral development will first be to get her example working, as is, with my theremin serial data, then redesign the interface a bit to familiarize myself with D3. Below are Nadieh's codes that I'm using to create the interface, calling on D3 and SerialPort (the JS/Serial communication package). The server side code is what runs the data acquisition from the serial connection and parses it to be used in the script side code that generates the evolving bar graph.
Server Code
/////// Express & Socket.io ///////
//Keep in order
const path = require('path');
const express = require('express');
const app = express();
const http = require('http');
const server = http.createServer(app);
const port_num = 3000;

const { Server } = require("socket.io");
const io = new Server(server);

app.use(express.static(path.join(__dirname, '/'))); //Had to add this otherwise it wouldn't work
app.get('/', (req, res) => {
    res.sendFile(__dirname + '/index.html');
})

io.on('connection', (socket) => {
    console.log('connection found');
    socket.on('disconnect', function(){
      console.log('disconnected');
    });
})//io.on

server.listen(port_num, () => {
    console.log(`listening on *:${port_num}`);
})

/////// Serial port ///////
const SerialPort = require('serialport');
const port = new SerialPort('COM7', {
    baudRate: 9600
})
const ReadLine = require('@serialport/parser-readline')
const parser = new ReadLine({delimiter: '\r\n'});

port.pipe(parser);
parser.on('data', readSerialData);

function readSerialData(data) {
    //console.log(data);
    io.emit('parsed-data', data);
}//function readSerialData
The main thing I needed to change here was the address to the serial port for my device. I couldn't exactly find a straightforward answer to how the SerialPort package wants to take that path, both the documentation and online forums were vague, but I did manage to find an example that worked using the tpyical COM specification like in the Arduino IDE. This seems like a reasonable place to start for me.
For the script side code, the only thing I need to change upfront is the scaling. The phototransistor Nadieh used maxed at 1023, but my application should be capped closer to 60. While large jumps can happen in the QTouch data when the user accidentaly touches the leads, the main bounds for the data is 0-50. Setting an upper bound of 75 seems like a reasonable starting point that I can work from.
Script Code
let socket = io()

//////////////////// Set-up the Visual ////////////////////

//10-bit value that can come in from the phototransistor
const max_value = 75

//Create SVG
const width = 500
const height = 850

const svg = d3.select("#chart").append("svg")
    .attr("width", width)
    .attr("height", height)
    .attr("class", "svg-chart")

//Create scales
const scale_color_wb = d3.scaleLinear()
    .domain([500, 950])
    .range(["white", "#0d0f1d"])
    .clamp(true)

const scale_color_bw = d3.scaleLinear()
    .domain([500, 950])
    .range(["#0d0f1d", "white"])
    .clamp(true)

const colors = ["#66489f", "#ff33a5", "#efb605"].reverse()
const scale_color_bars = d3.scaleLinear()
    .domain(d3.range(colors.length).map(d => { return d/(colors.length-1) * max_value}))
    .range(colors)
    .clamp(true)

///////////////////// Background color ////////////////////

const rect_background = svg.append("rect")
    .attr("class", "background")
    .attr("x", 0)
    .attr("y", 0)
    .attr("width", width)
    .attr("height", height)
    .style("opacity", 0.7)

function updateBackground(data) {
    rect_background.style("fill", scale_color_bars(data))
}//function updateBackground

////////////////// Text on the background /////////////////

const text_value = svg.append("text")
    .attr("class", "background-text")
    .attr("transform", `translate(${width/2}, ${height/2})`)
    .style("text-anchor", "middle")
    .style("font-size", "170px")

function updateText(data) {
    text_value
        .style("fill", "white") //scale_color_wb(data))
        .text(data)
}//function updateText

//////////////////////// Bar chart ////////////////////////
const bar_group = svg.append("g")
    .attr("class", "bar-group")
    .attr("transform", `translate(${width/2}, ${0})`)

const bar_width = 25
const bar_height = 6
const bar_corner = bar_height/2

function updateBars(data) {
    let num_bars = Math.round(data/10)

    //Append new data to the group
    let bars = bar_group.selectAll(".bar")
        .data(d3.range(num_bars), d => d)

    //EXIT
    bars.exit().remove()

    //ENTER - Group
    let enter_bars = bars.enter()
        .append("rect")
        .attr("class", "bar")
        .attr("id", d => `bar-${d}`)
        .attr("x", -bar_width/2)
        .attr("width", bar_width)
        .attr("height", bar_height)
        .attr("rx", bar_corner)
        .style("fill", d => scale_color_bars(d * 10))

    //MERGE
    bars = enter_bars.merge(bars)

    /////////////////////// ENTER + UPDATE //////////////////////
    bars
        .attr("y", d => height - d * (bar_height + 2))
}//function updateBars


///////////////////////// Get Data ////////////////////////
//Get the data from the serial port and update the visual
socket.on('connect', function () {
    socket.on('parsed-data', function (data) {
        //console.log(data)

        //Update the visual
        updateBackground(data)
        updateText(data)
        updateBars(data)
    })//socket.on
})//socket.on
This is where I started running into problems. As I called on node to execute the scripts I would recieve no errors but also no actions from the terminal. In some basic tests to see if I was able to stream any serial data from the SAMD I got nothing as well. When I tried to have SerialPort list the available serial ports and their addresses I got nothing. This was rather frustrating, and I can tell I am close to my goal, but that I am likely missing a simple but crucial aspect of this code. Debugging this, in combination with the holiday, ate up my time for the week, and means that this is where I leave it for now. I will need to come back to this and get some further help with JavaScript. I am still happy with my 'Hello World' since that was a big accomplishment for me, but a few extra days (and some help from the TAs) will yeild the results I am looking for. It's getting to be crunch time, so I'll need to budget extra time for revisiting this task while also ensuring my final project progresses as planned.
UPDATE
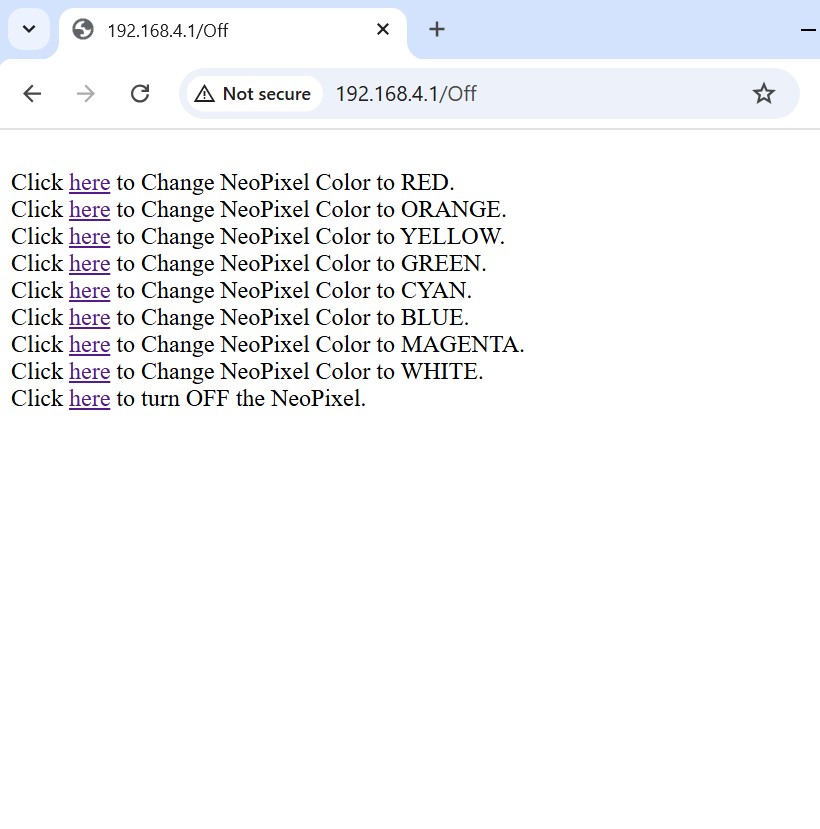
So I couldn't get the node.js example working the way I wanted to, but I was able to do a super simple interface for my NeoPixel that I made during Networking week. Using the wifi server example and modifying it a bit, I have an interface for the NeoPixel that can select a rainbow of colors. Super simple, but its something! Below is a picture of the HTML interface, a video of it working (while I'm flying on a plane) and the code for the NeoPixel "app".
							/*
  WiFiAccessPoint.ino creates a WiFi access point and provides a web server on it.

  Steps:
  1. Connect to the access point "yourAp"
  2. Point your web browser to http://192.168.4.1/H to turn the LED on or http://192.168.4.1/L to turn it off
     OR
     Run raw TCP "GET /H" and "GET /L" on PuTTY terminal with 192.168.4.1 as IP address and 80 as port

  Created for arduino-esp32 on 04 July, 2018
  by Elochukwu Ifediora (fedy0)
*/

#include
#include
#include
#include

#define PIN_NEO_PIXEL D0  // The ESP32 pin GPIO16 connected to NeoPixel
#define NUM_PIXELS 1      // The number of LEDs (pixels) on NeoPixel

Adafruit_NeoPixel NeoPixel(NUM_PIXELS, PIN_NEO_PIXEL, NEO_GRB + NEO_KHZ800);

// Set these to your desired credentials.
const char *ssid = "XIAO_ESP32_HTMAA";
const char *password = "HTMAA2024";

NetworkServer server(80);

void setup() {

  Serial.begin(115200);
  Serial.println();
  Serial.println("Configuring access point...");

  // You can remove the password parameter if you want the AP to be open.
  // a valid password must have more than 7 characters
  if (!WiFi.softAP(ssid, password)) {
    log_e("Soft AP creation failed.");
    while (1);
  }
  IPAddress myIP = WiFi.softAPIP();
  Serial.print("AP IP address: ");
  Serial.println(myIP);
  server.begin();

  Serial.println("Server started");

  pinMode(3, OUTPUT);    // RF switch power on
  digitalWrite(3, LOW);
  pinMode(14, OUTPUT);   // select external antenna
  digitalWrite(14, HIGH);

  NeoPixel.begin();
}

void loop() {
  NetworkClient client = server.accept();  // listen for incoming clients

  if (client) {                     // if you get a client,
    Serial.println("New Client.");  // print a message out the serial port
    String currentLine = "";        // make a String to hold incoming data from the client
    while (client.connected()) {    // loop while the client's connected
      if (client.available()) {     // if there's bytes to read from the client,
        char c = client.read();     // read a byte, then
        Serial.write(c);            // print it out the serial monitor
        if (c == '\n') {            // if the byte is a newline character

          // if the current line is blank, you got two newline characters in a row.
          // that's the end of the client HTTP request, so send a response:
          if (currentLine.length() == 0) {
            // HTTP headers always start with a response code (e.g. HTTP/1.1 200 OK)
            // and a content-type so the client knows what's coming, then a blank line:
            client.println("HTTP/1.1 200 OK");
            client.println("Content-type:text/html");
            client.println();

            // the content of the HTTP response follows the header:
            client.print("
");
            client.print("  Click here to Change NeoPixel Color to RED.
");
            client.print("  Click here to Change NeoPixel Color to ORANGE.
");
            client.print("  Click here to Change NeoPixel Color to YELLOW.
");
            client.print("  Click here to Change NeoPixel Color to GREEN.
");
            client.print("  Click here to Change NeoPixel Color to CYAN.
");
            client.print("  Click here to Change NeoPixel Color to BLUE.
");
            client.print("  Click here to Change NeoPixel Color to MAGENTA.
");
            client.print("  Click here to Change NeoPixel Color to WHITE.
");
            client.print("  Click here to turn OFF the NeoPixel.
");

            // The HTTP response ends with another blank line:
            client.println();
            // break out of the while loop:
            break;
          } else {  // if you got a newline, then clear currentLine:
            currentLine = "";
          }
        } else if (c != '\r') {  // if you got anything else but a carriage return character,
          currentLine += c;      // add it to the end of the currentLine
        }

        // Check to see what color the client request was:
        if (currentLine.endsWith("GET /Red")) {
          NeoPixel.setPixelColor(0, NeoPixel.Color(100, 0, 0));
          NeoPixel.show();
        }
        if (currentLine.endsWith("GET /Orange")) {
          NeoPixel.setPixelColor(0, NeoPixel.Color(100, 50, 0));
          NeoPixel.show();
        }
        if (currentLine.endsWith("GET /Yellow")) {
          NeoPixel.setPixelColor(0, NeoPixel.Color(100, 100, 0));
          NeoPixel.show();
        }
        if (currentLine.endsWith("GET /Green")) {
          NeoPixel.setPixelColor(0, NeoPixel.Color(0, 100, 0));
          NeoPixel.show();
        }
        if (currentLine.endsWith("GET /Cyan")) {
          NeoPixel.setPixelColor(0, NeoPixel.Color(0, 100, 100));
          NeoPixel.show();
        }
        if (currentLine.endsWith("GET /Blue")) {
          NeoPixel.setPixelColor(0, NeoPixel.Color(0, 0, 100));
          NeoPixel.show();
        }
        if (currentLine.endsWith("GET /Magenta")) {
          NeoPixel.setPixelColor(0, NeoPixel.Color(100, 0, 100));
          NeoPixel.show();
        }
        if (currentLine.endsWith("GET /White")) {
          NeoPixel.setPixelColor(0, NeoPixel.Color(100, 100, 100));
          NeoPixel.show();
        }
        if (currentLine.endsWith("GET /Off")) {
          NeoPixel.clear();
          NeoPixel.show();
        }
      }
    }
    // close the connection:
    client.stop();
    Serial.println("Client Disconnected.");
  }
}
